
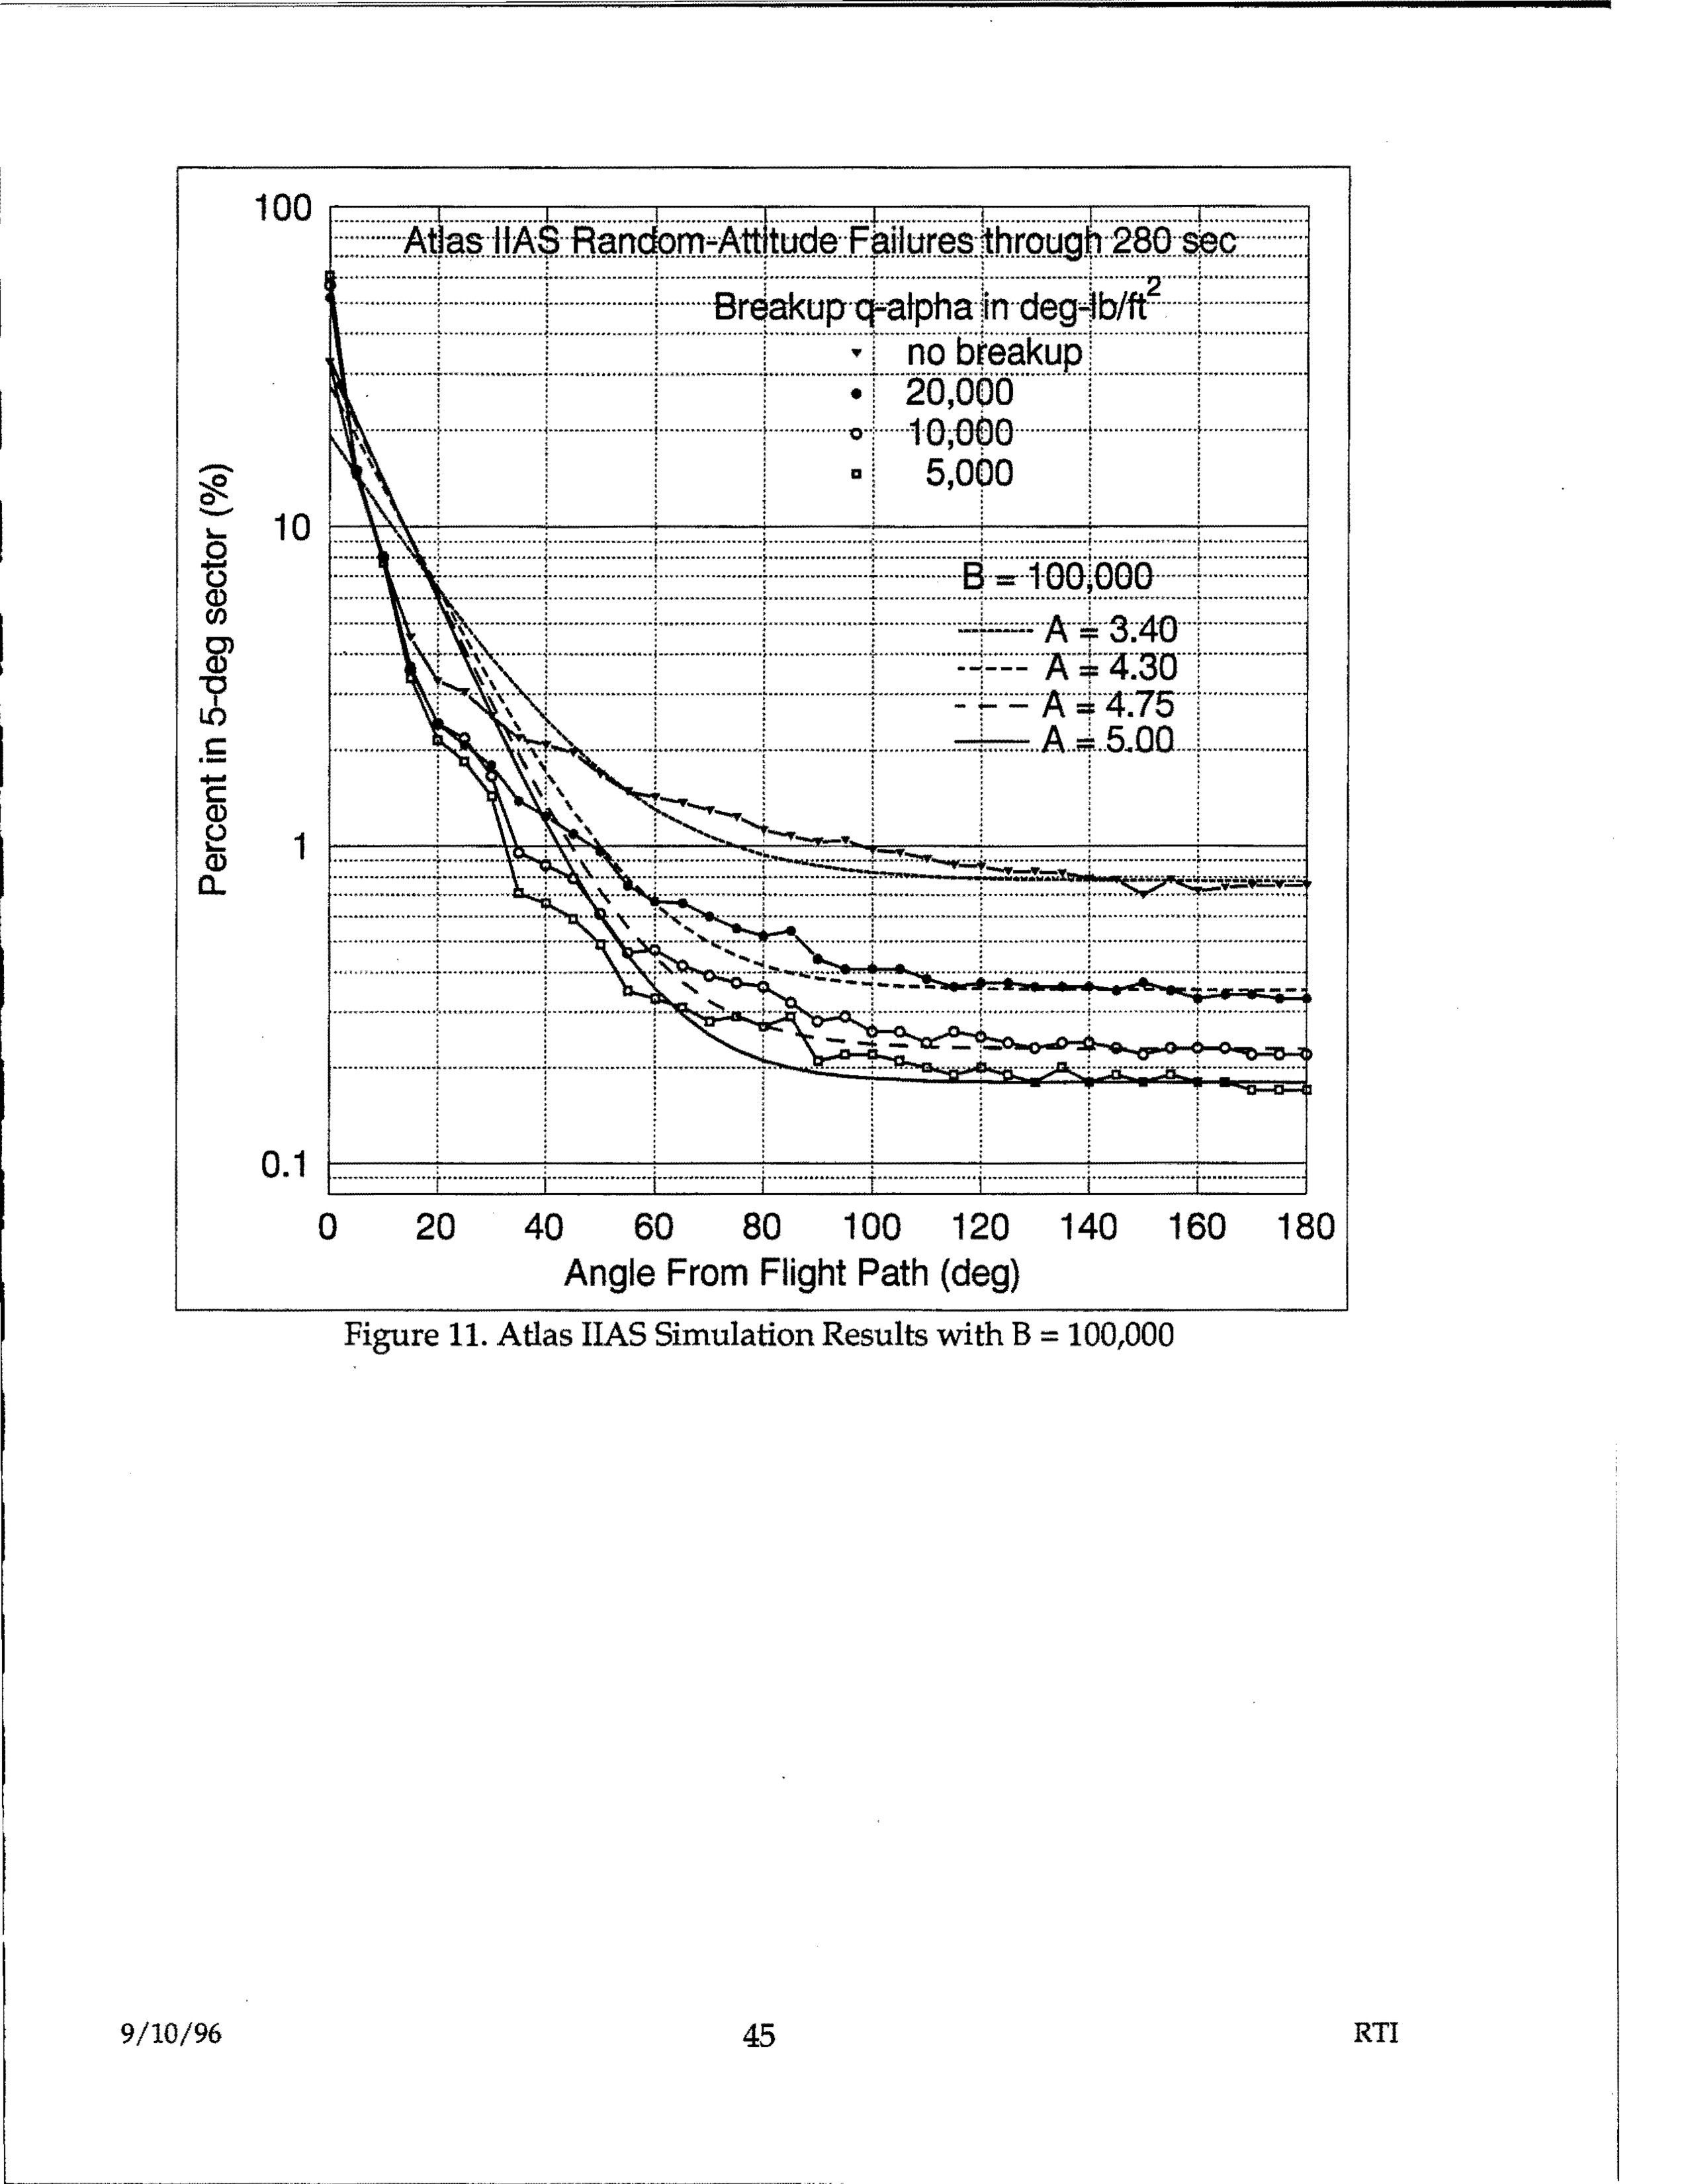
Figure 11. Atlas IIAS Simulation Results with B = 100,000 - Graph showing Atlas IIAS Random-Attitude Failures through 280 sec, plotting Percent in 5-deg sector vs Angle From Flight Path (deg), with multiple curves for different Breakup q-alpha values in deg-lb/ft² (no breakup, 20,000, 10,000, 5,000) and B = 100,000 with A values of 3.40, 4.30, 4.75, and 5.00
photoRelated photos
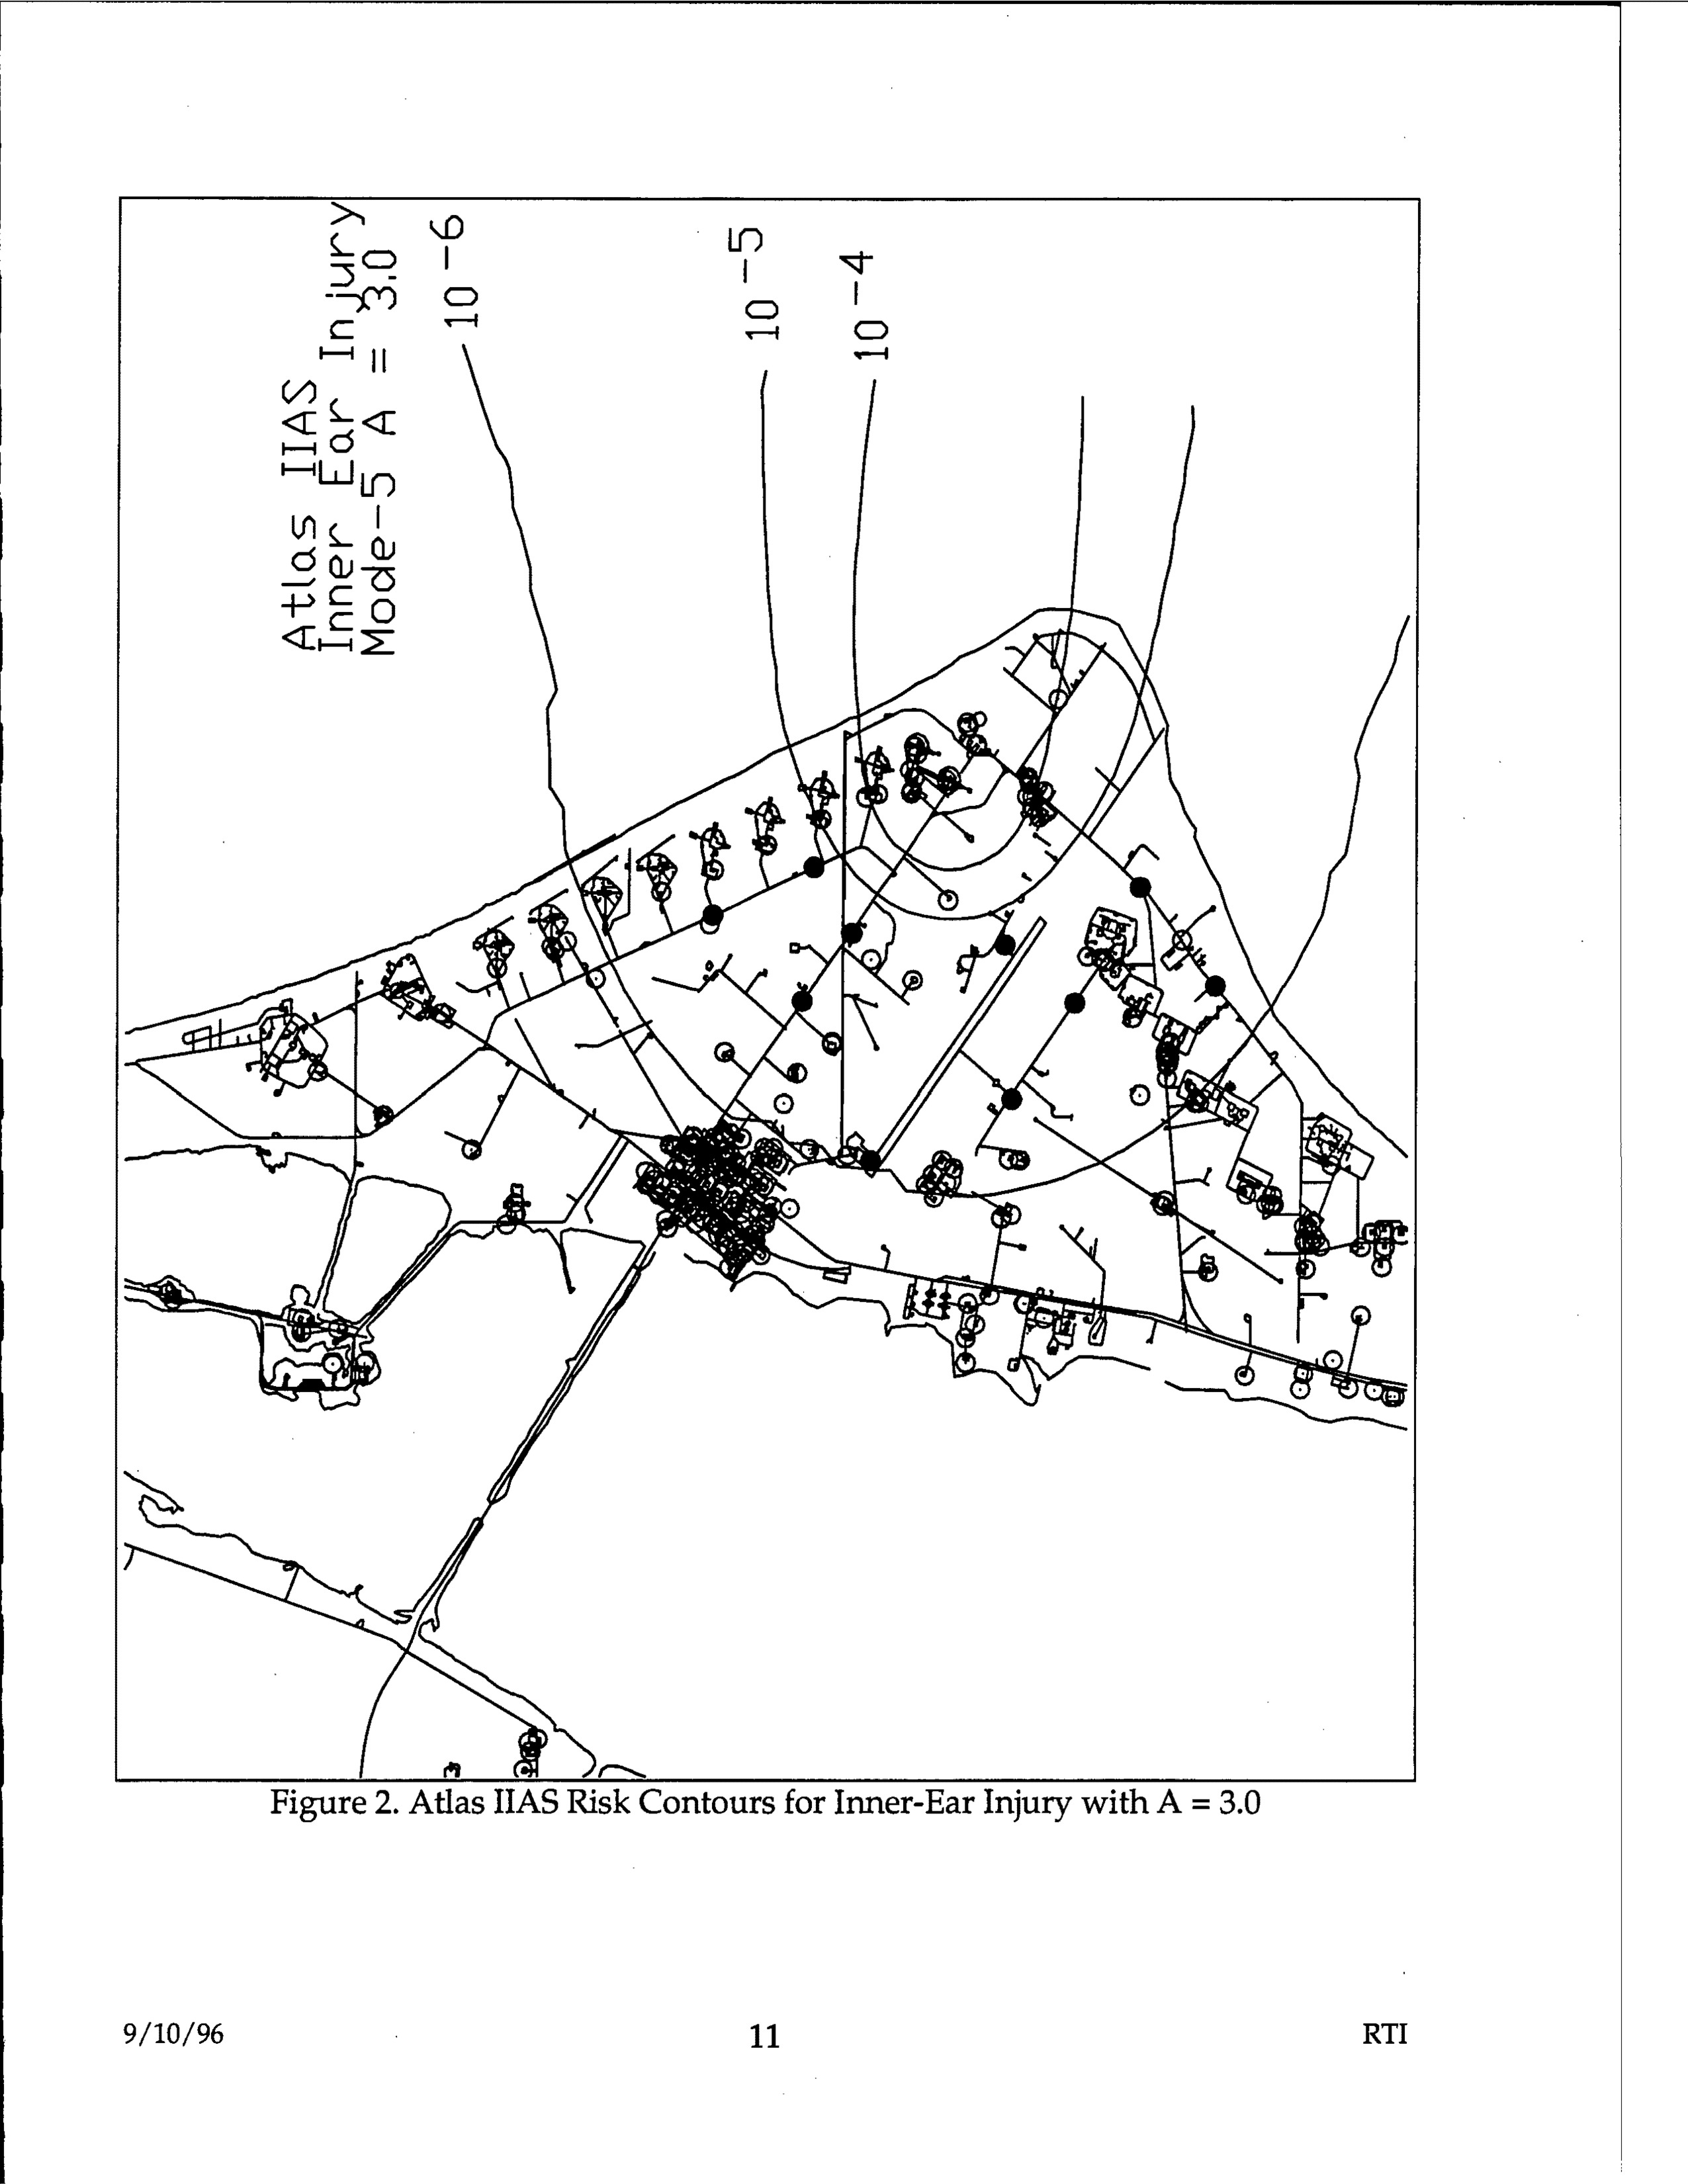
Atlas IIAS risk contours map showing inner-ear injury zones with concentric circles marked 10^-6, 10^-5, and 10^-4, with Mode-5A notation and A=3.0 parameter
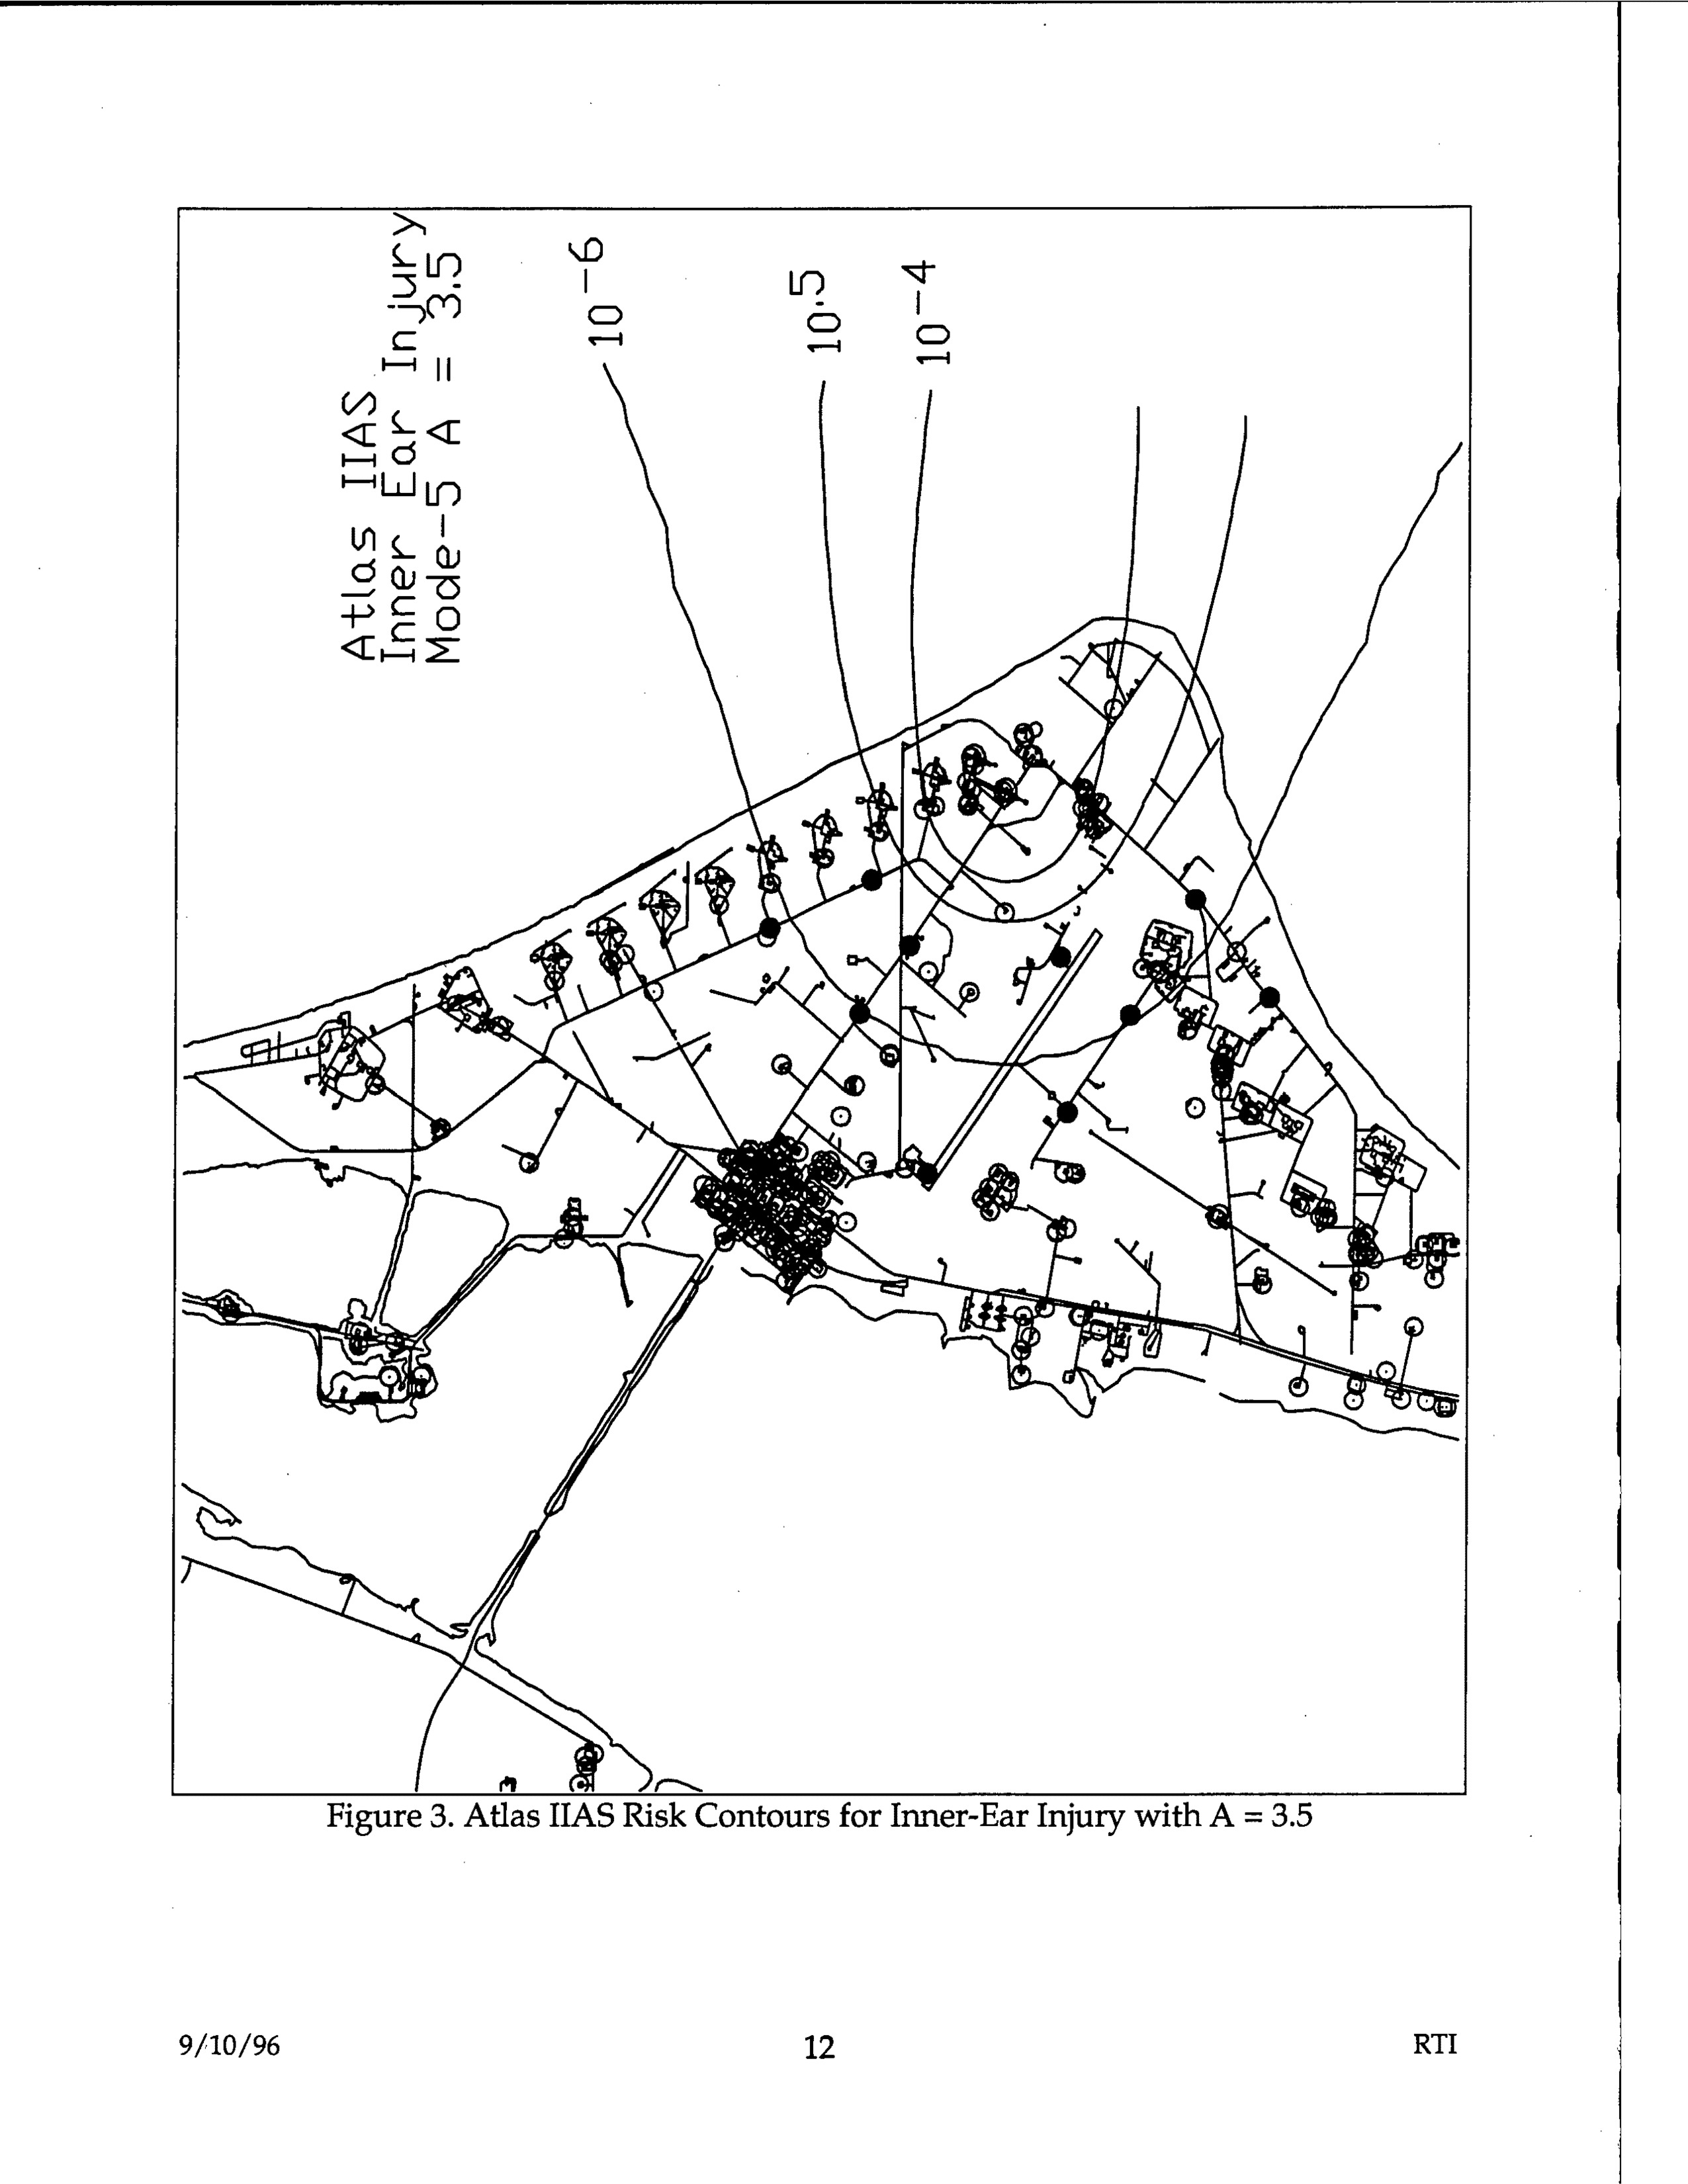
Figure 3. Atlas IIAS Risk Contours for Inner-Ear Injury with A = 3.5
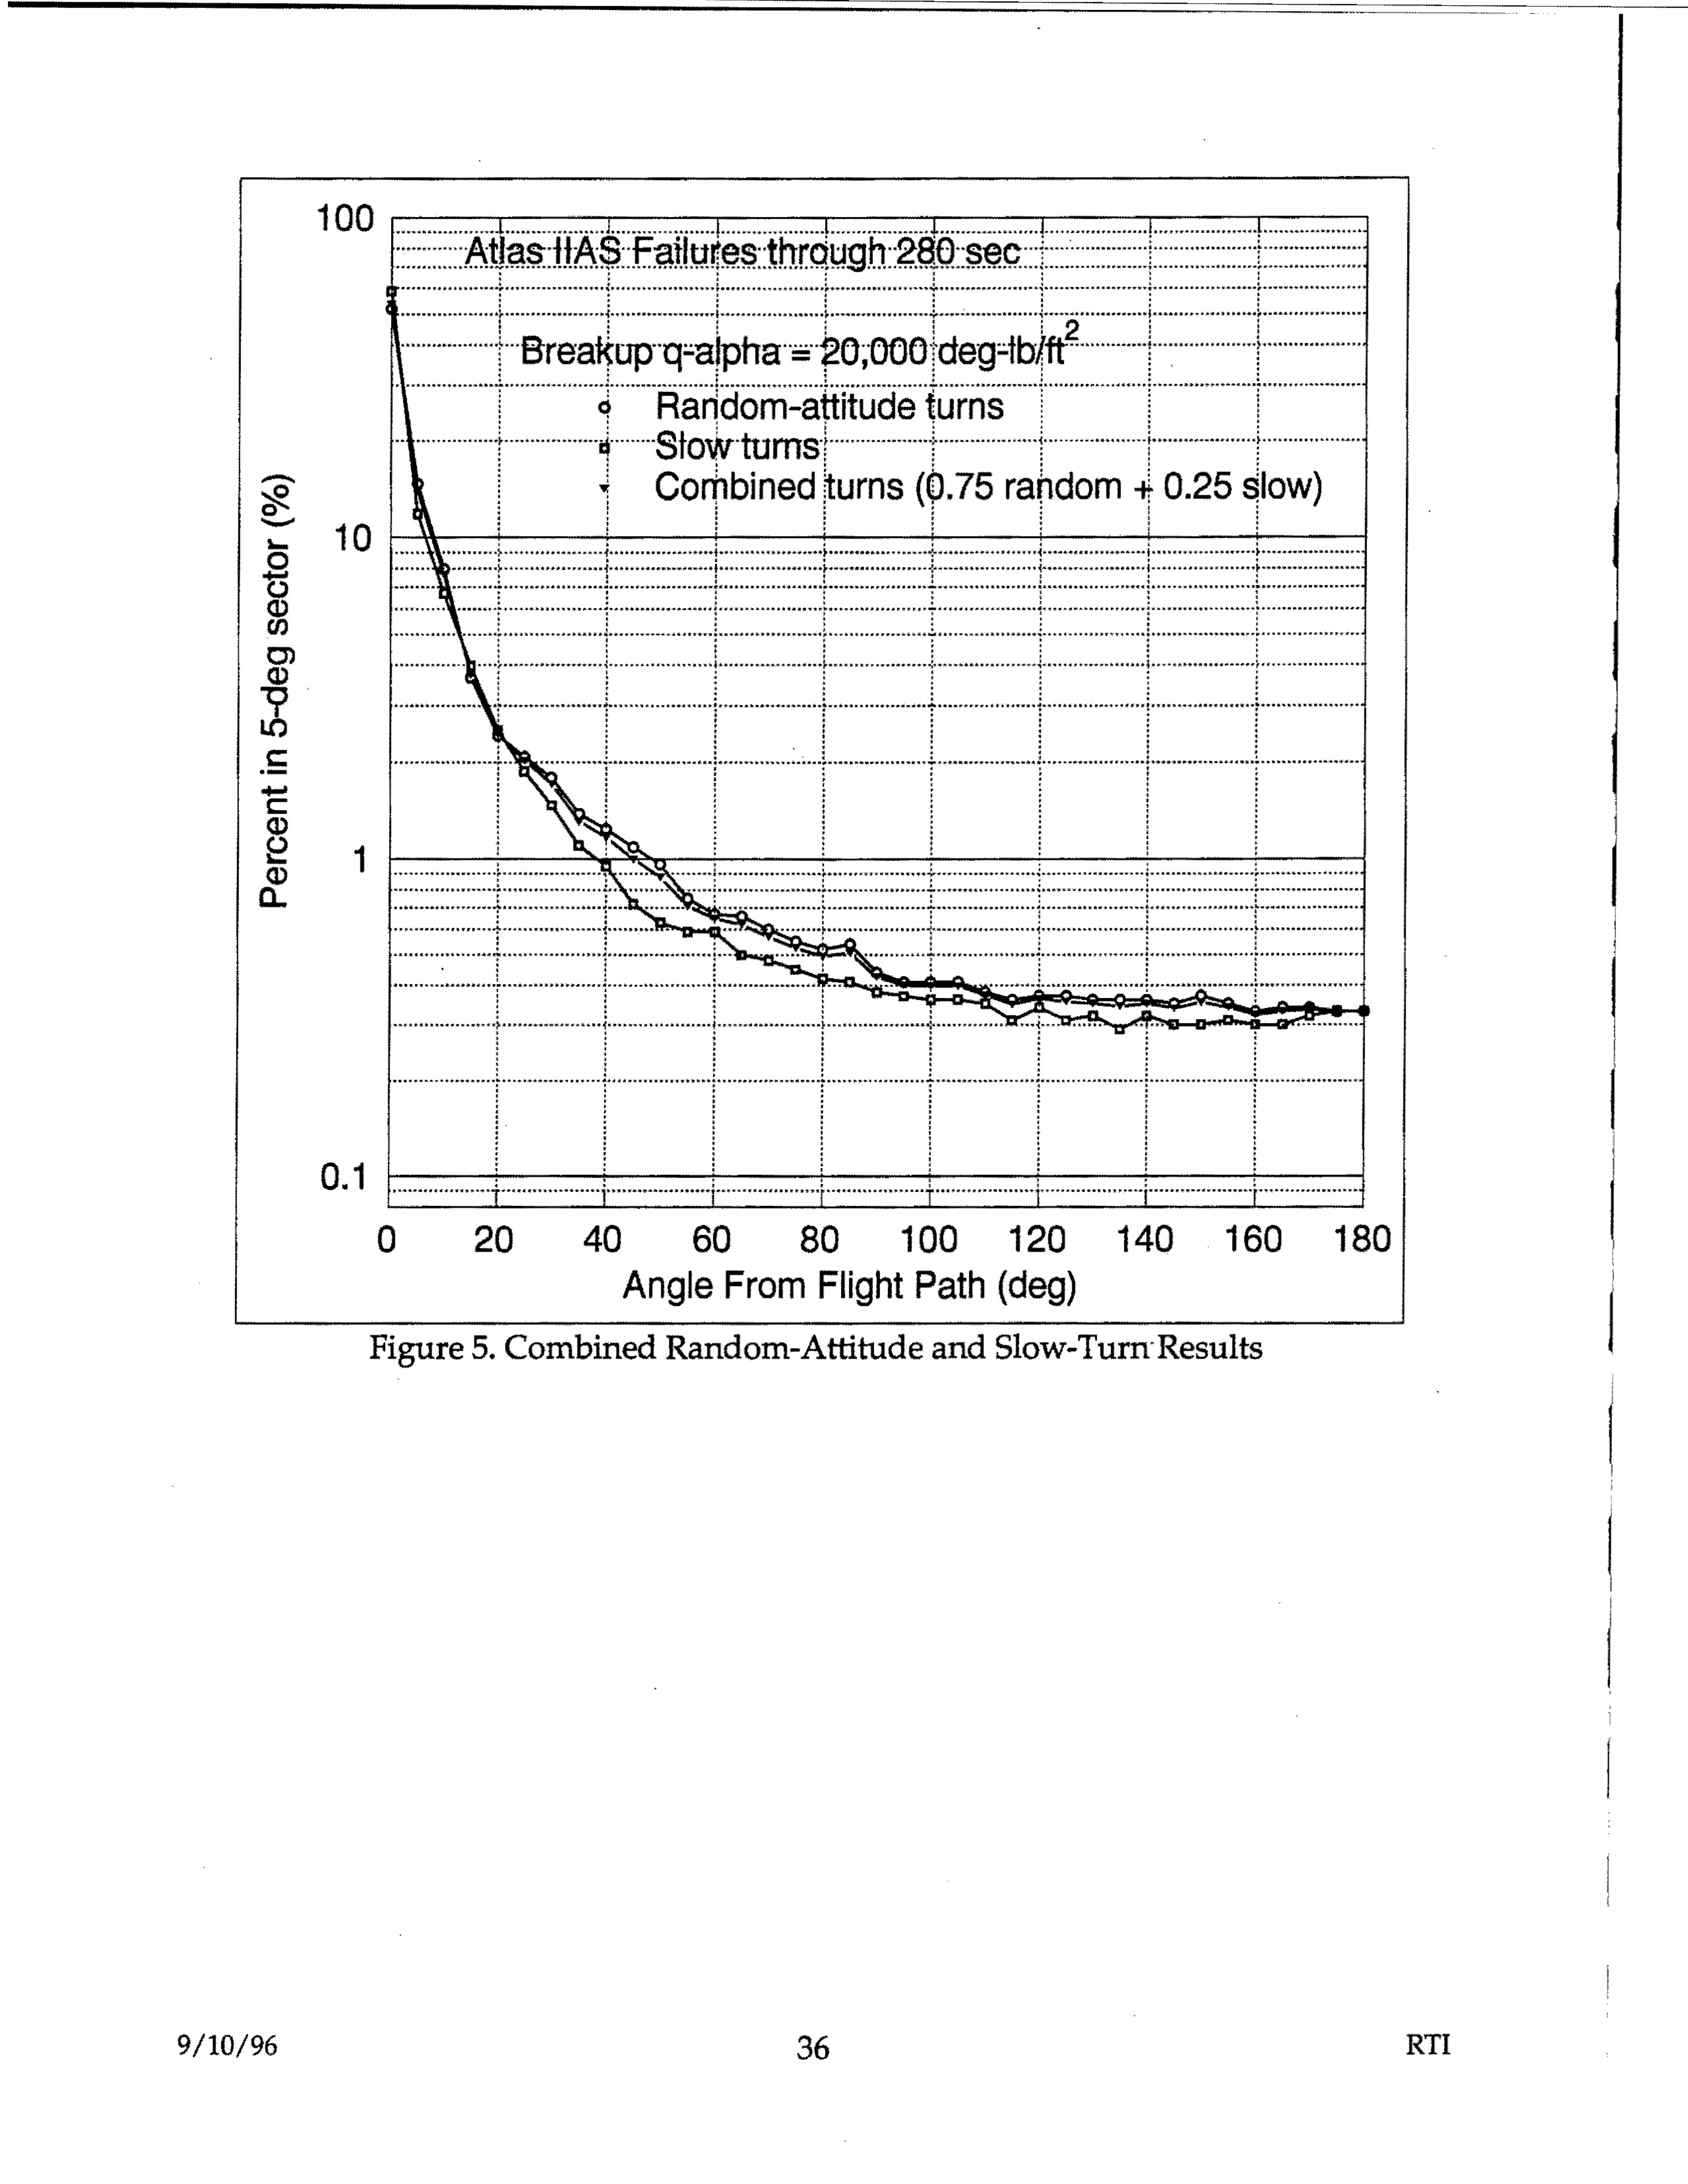
Atlas IIAS Failures through 280 sec - Breakup q-alpha = 20,000 deg-lb/ft² - Random-attitude turns, Slow turns, Combined turns (0.75 random + 0.25 slow) - Percent in 5-deg sector vs Angle From Flight Path (deg)
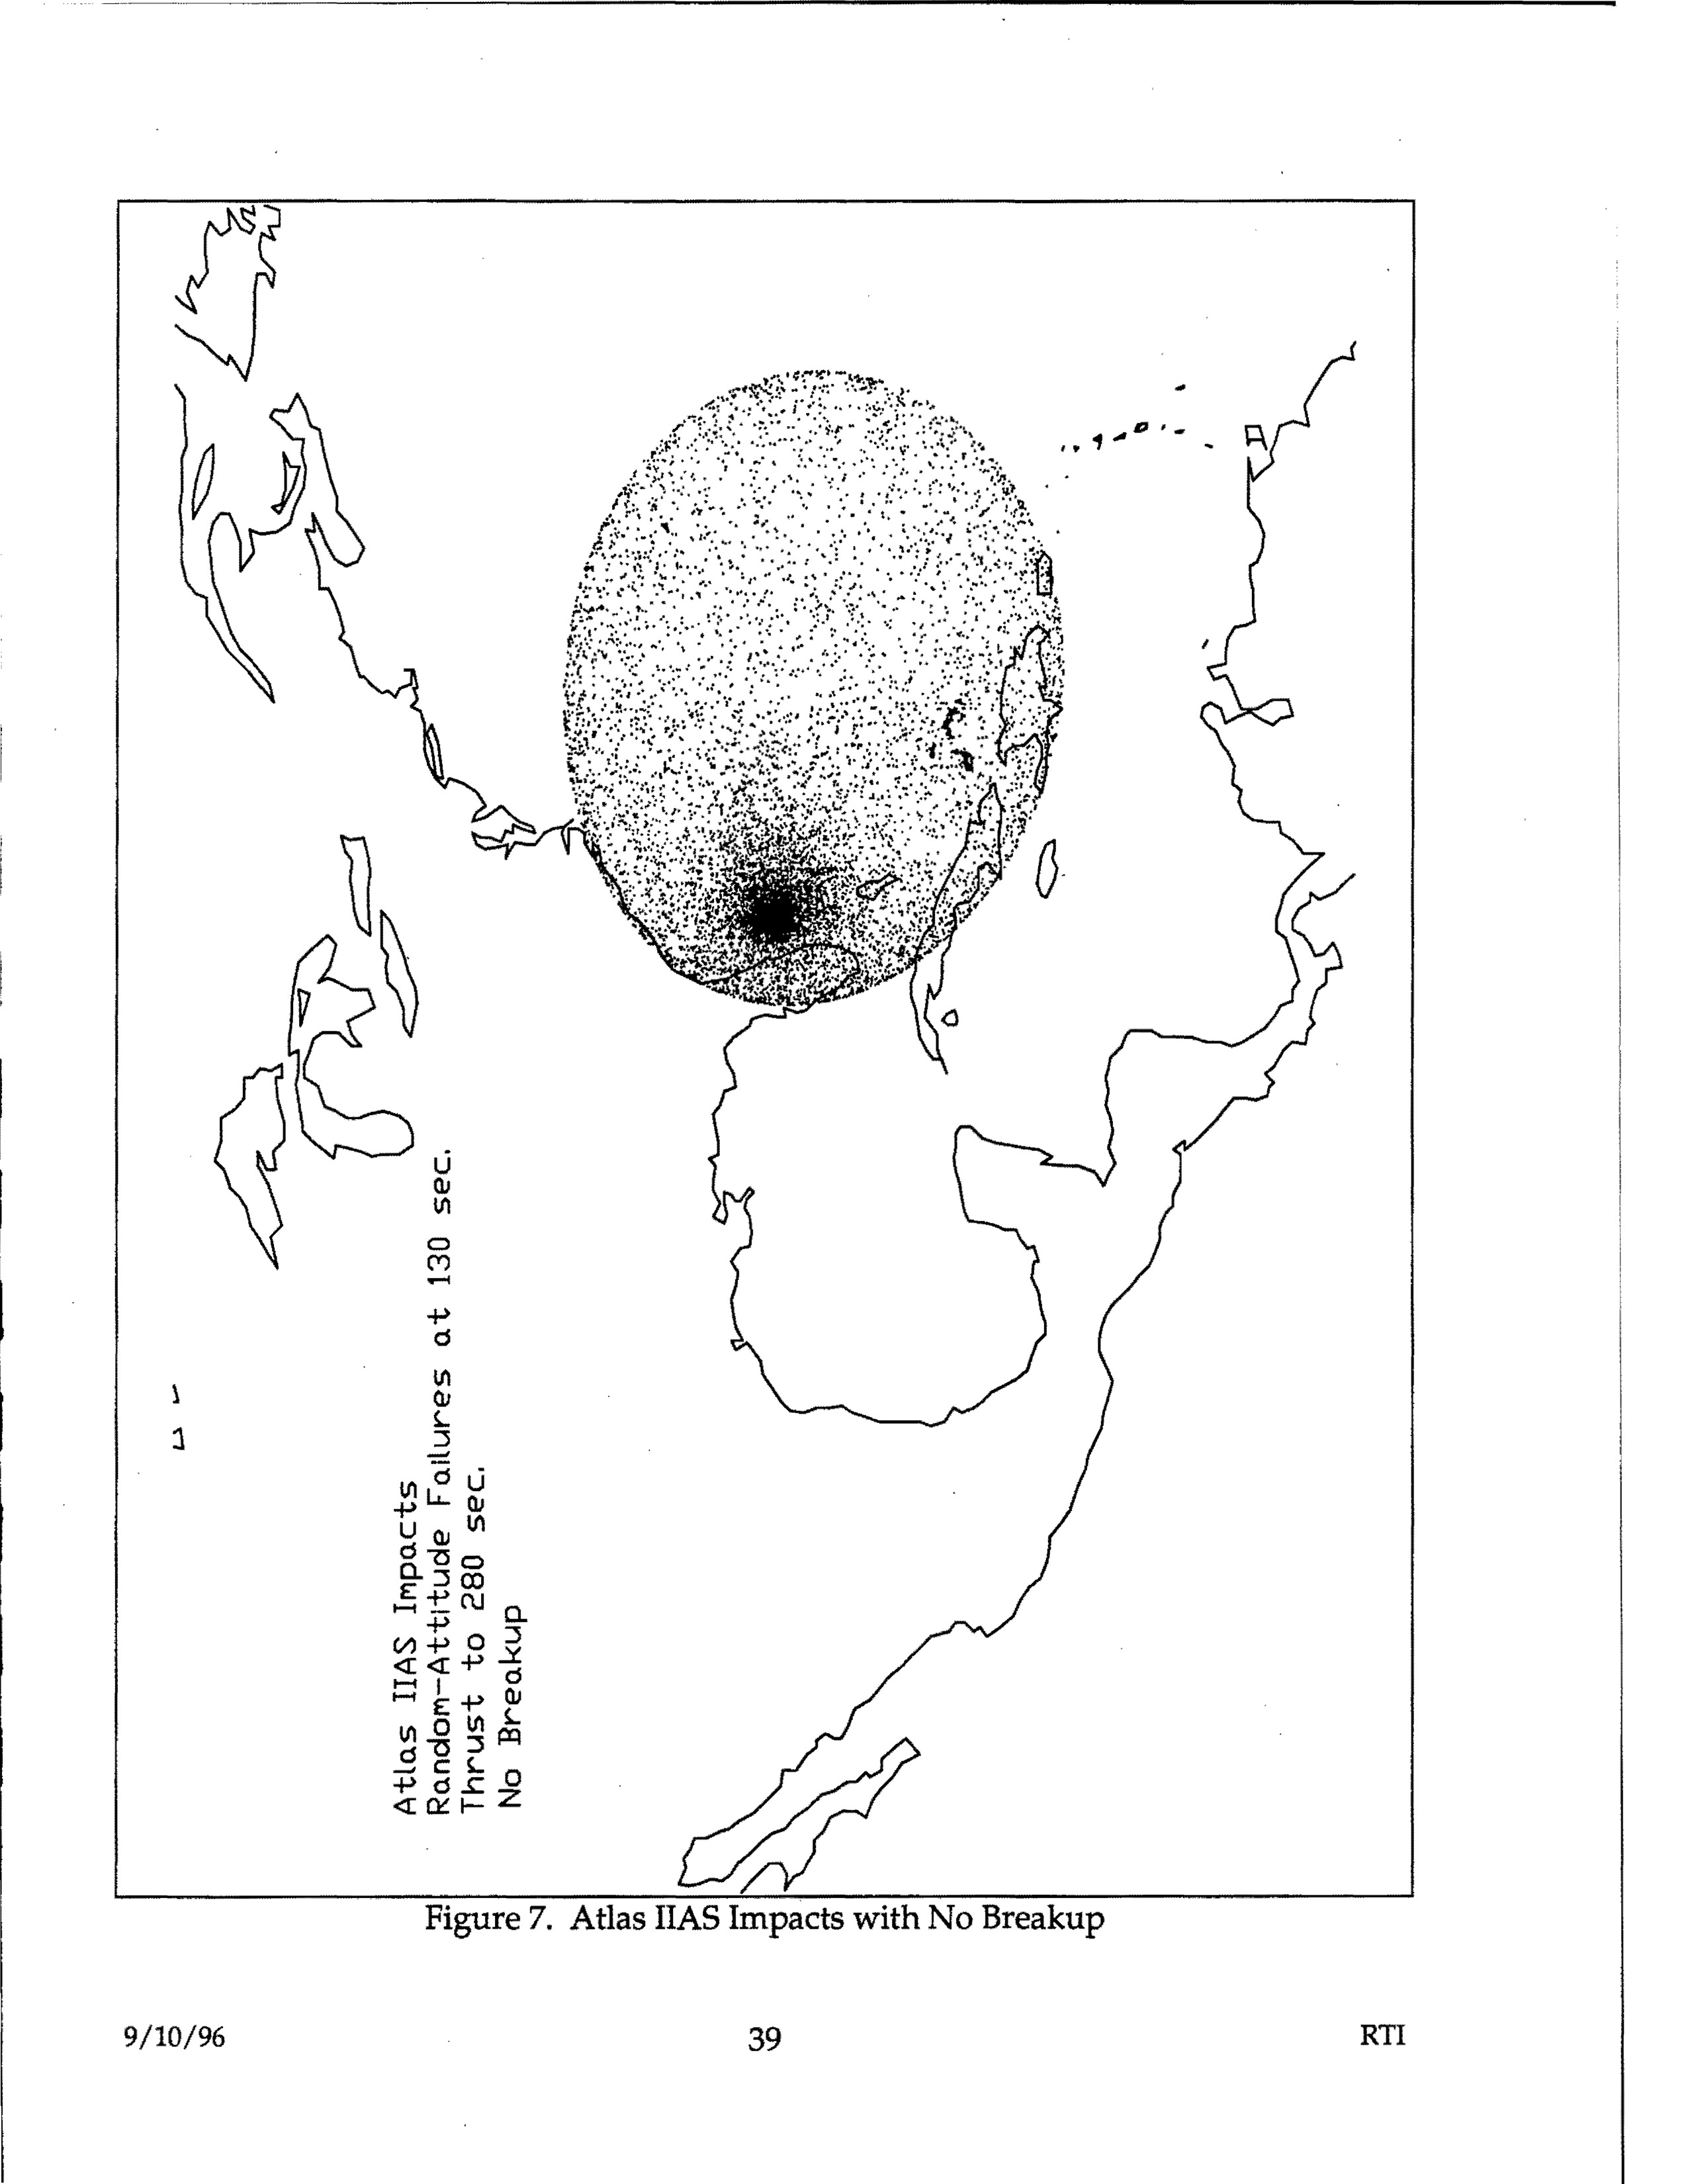
Atlas IIAS Impacts with No Breakup - map showing random-attitude failures at t30 sec thrust to 280 sec with impact footprint overlay
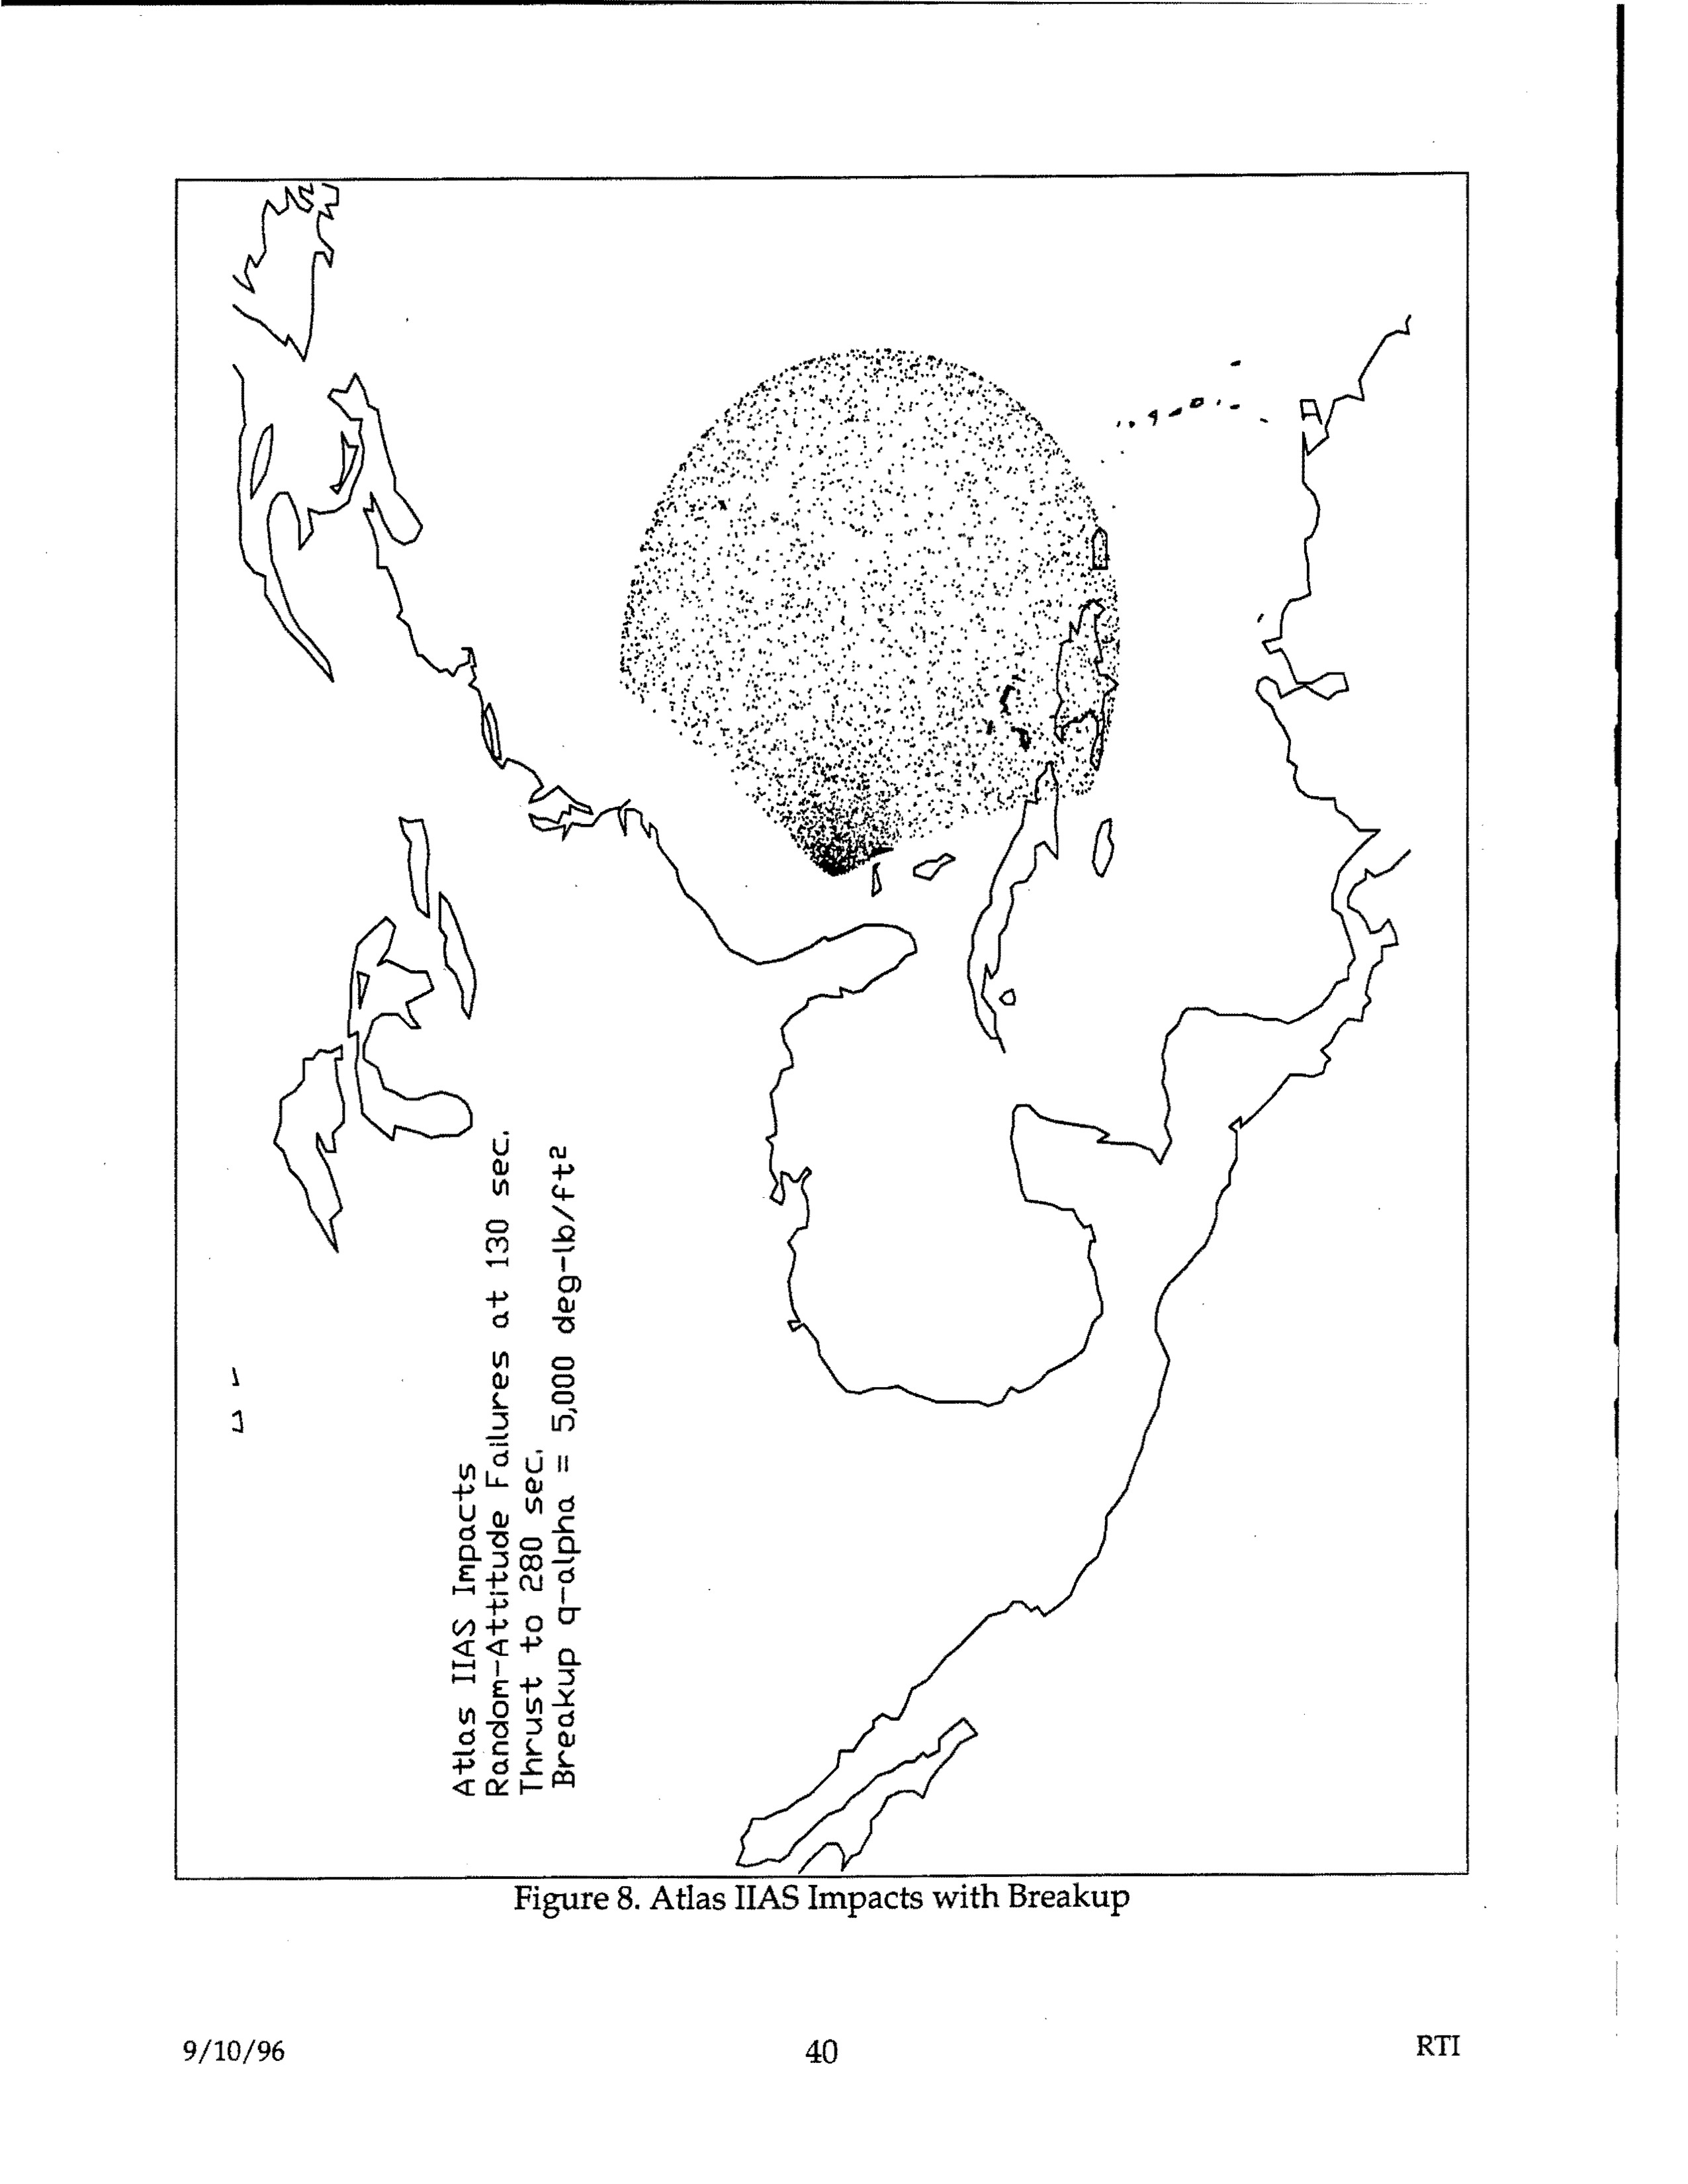
Atlas IIAS Impacts with Breakup - Random-Attitude Failures at 130 sec, Thrust to 230 sec, Breakup q-alpha = 5000 deg-lb/ft²
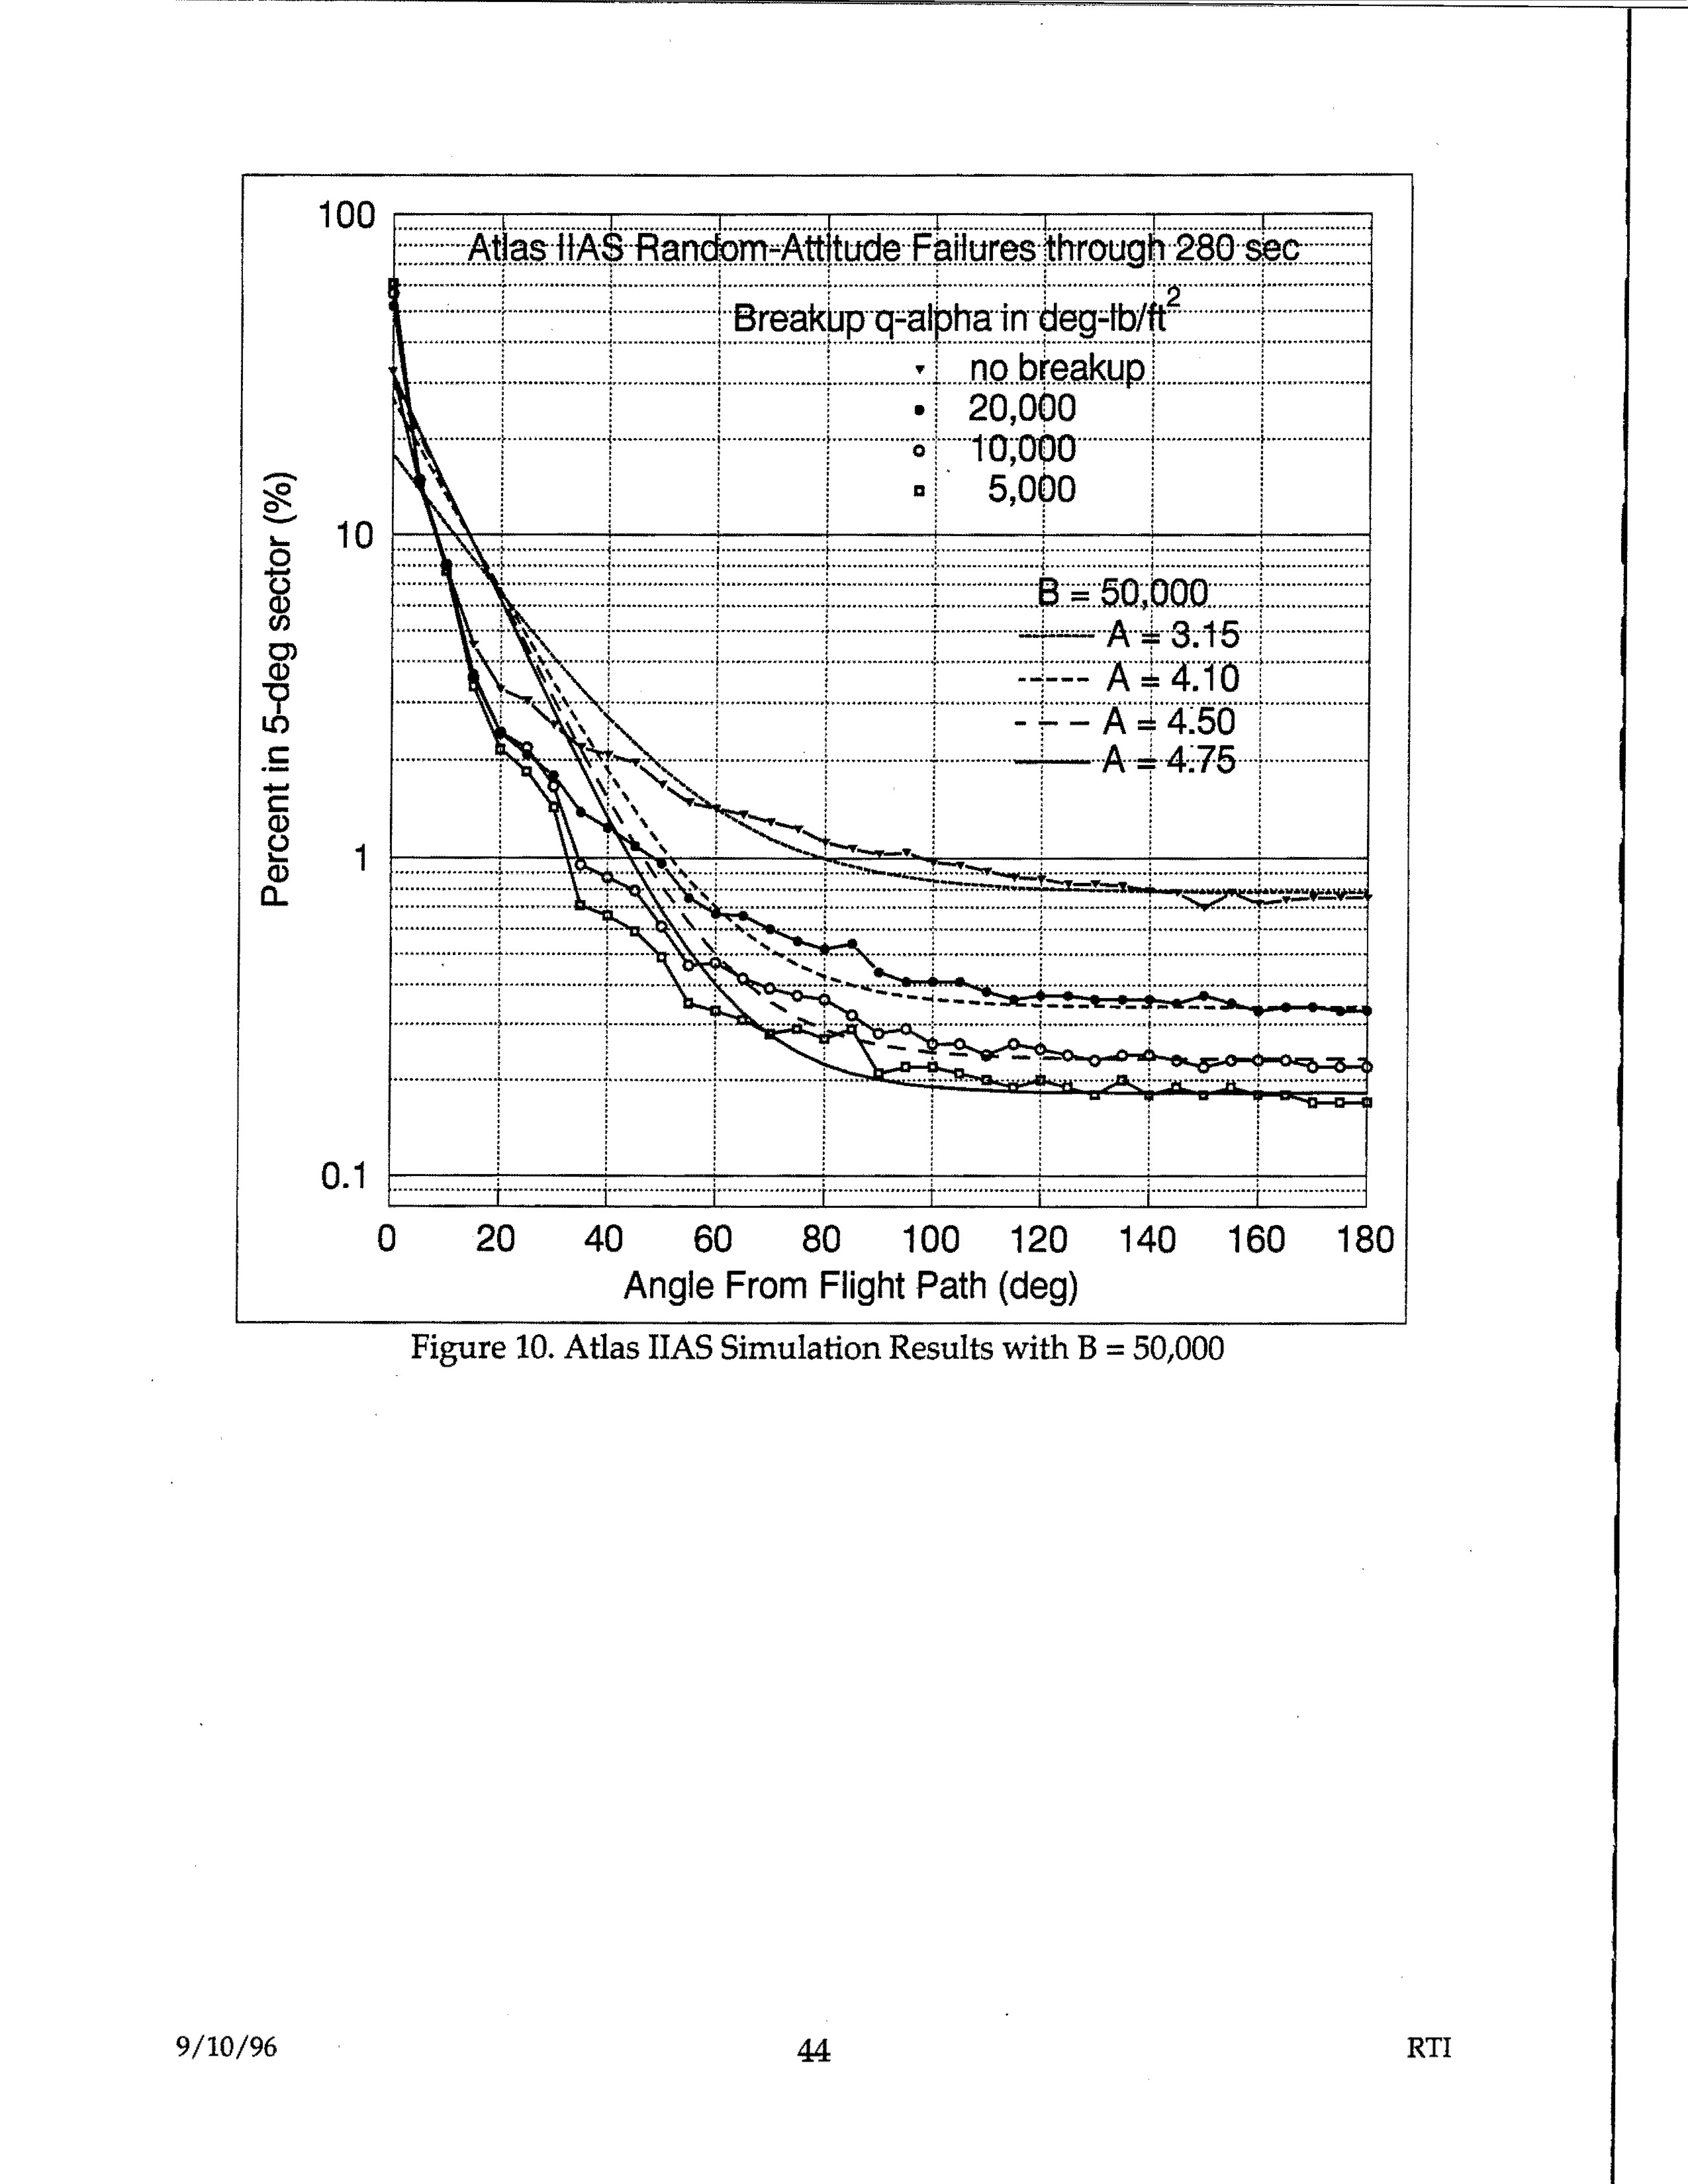
Figure 10. Atlas IIAS Simulation Results with B = 50,000 - Graph showing Percent in 5-deg sector (%) vs Angle From Flight Path (deg), with multiple curves for different Breakup q-alpha values in deg-lb/ft
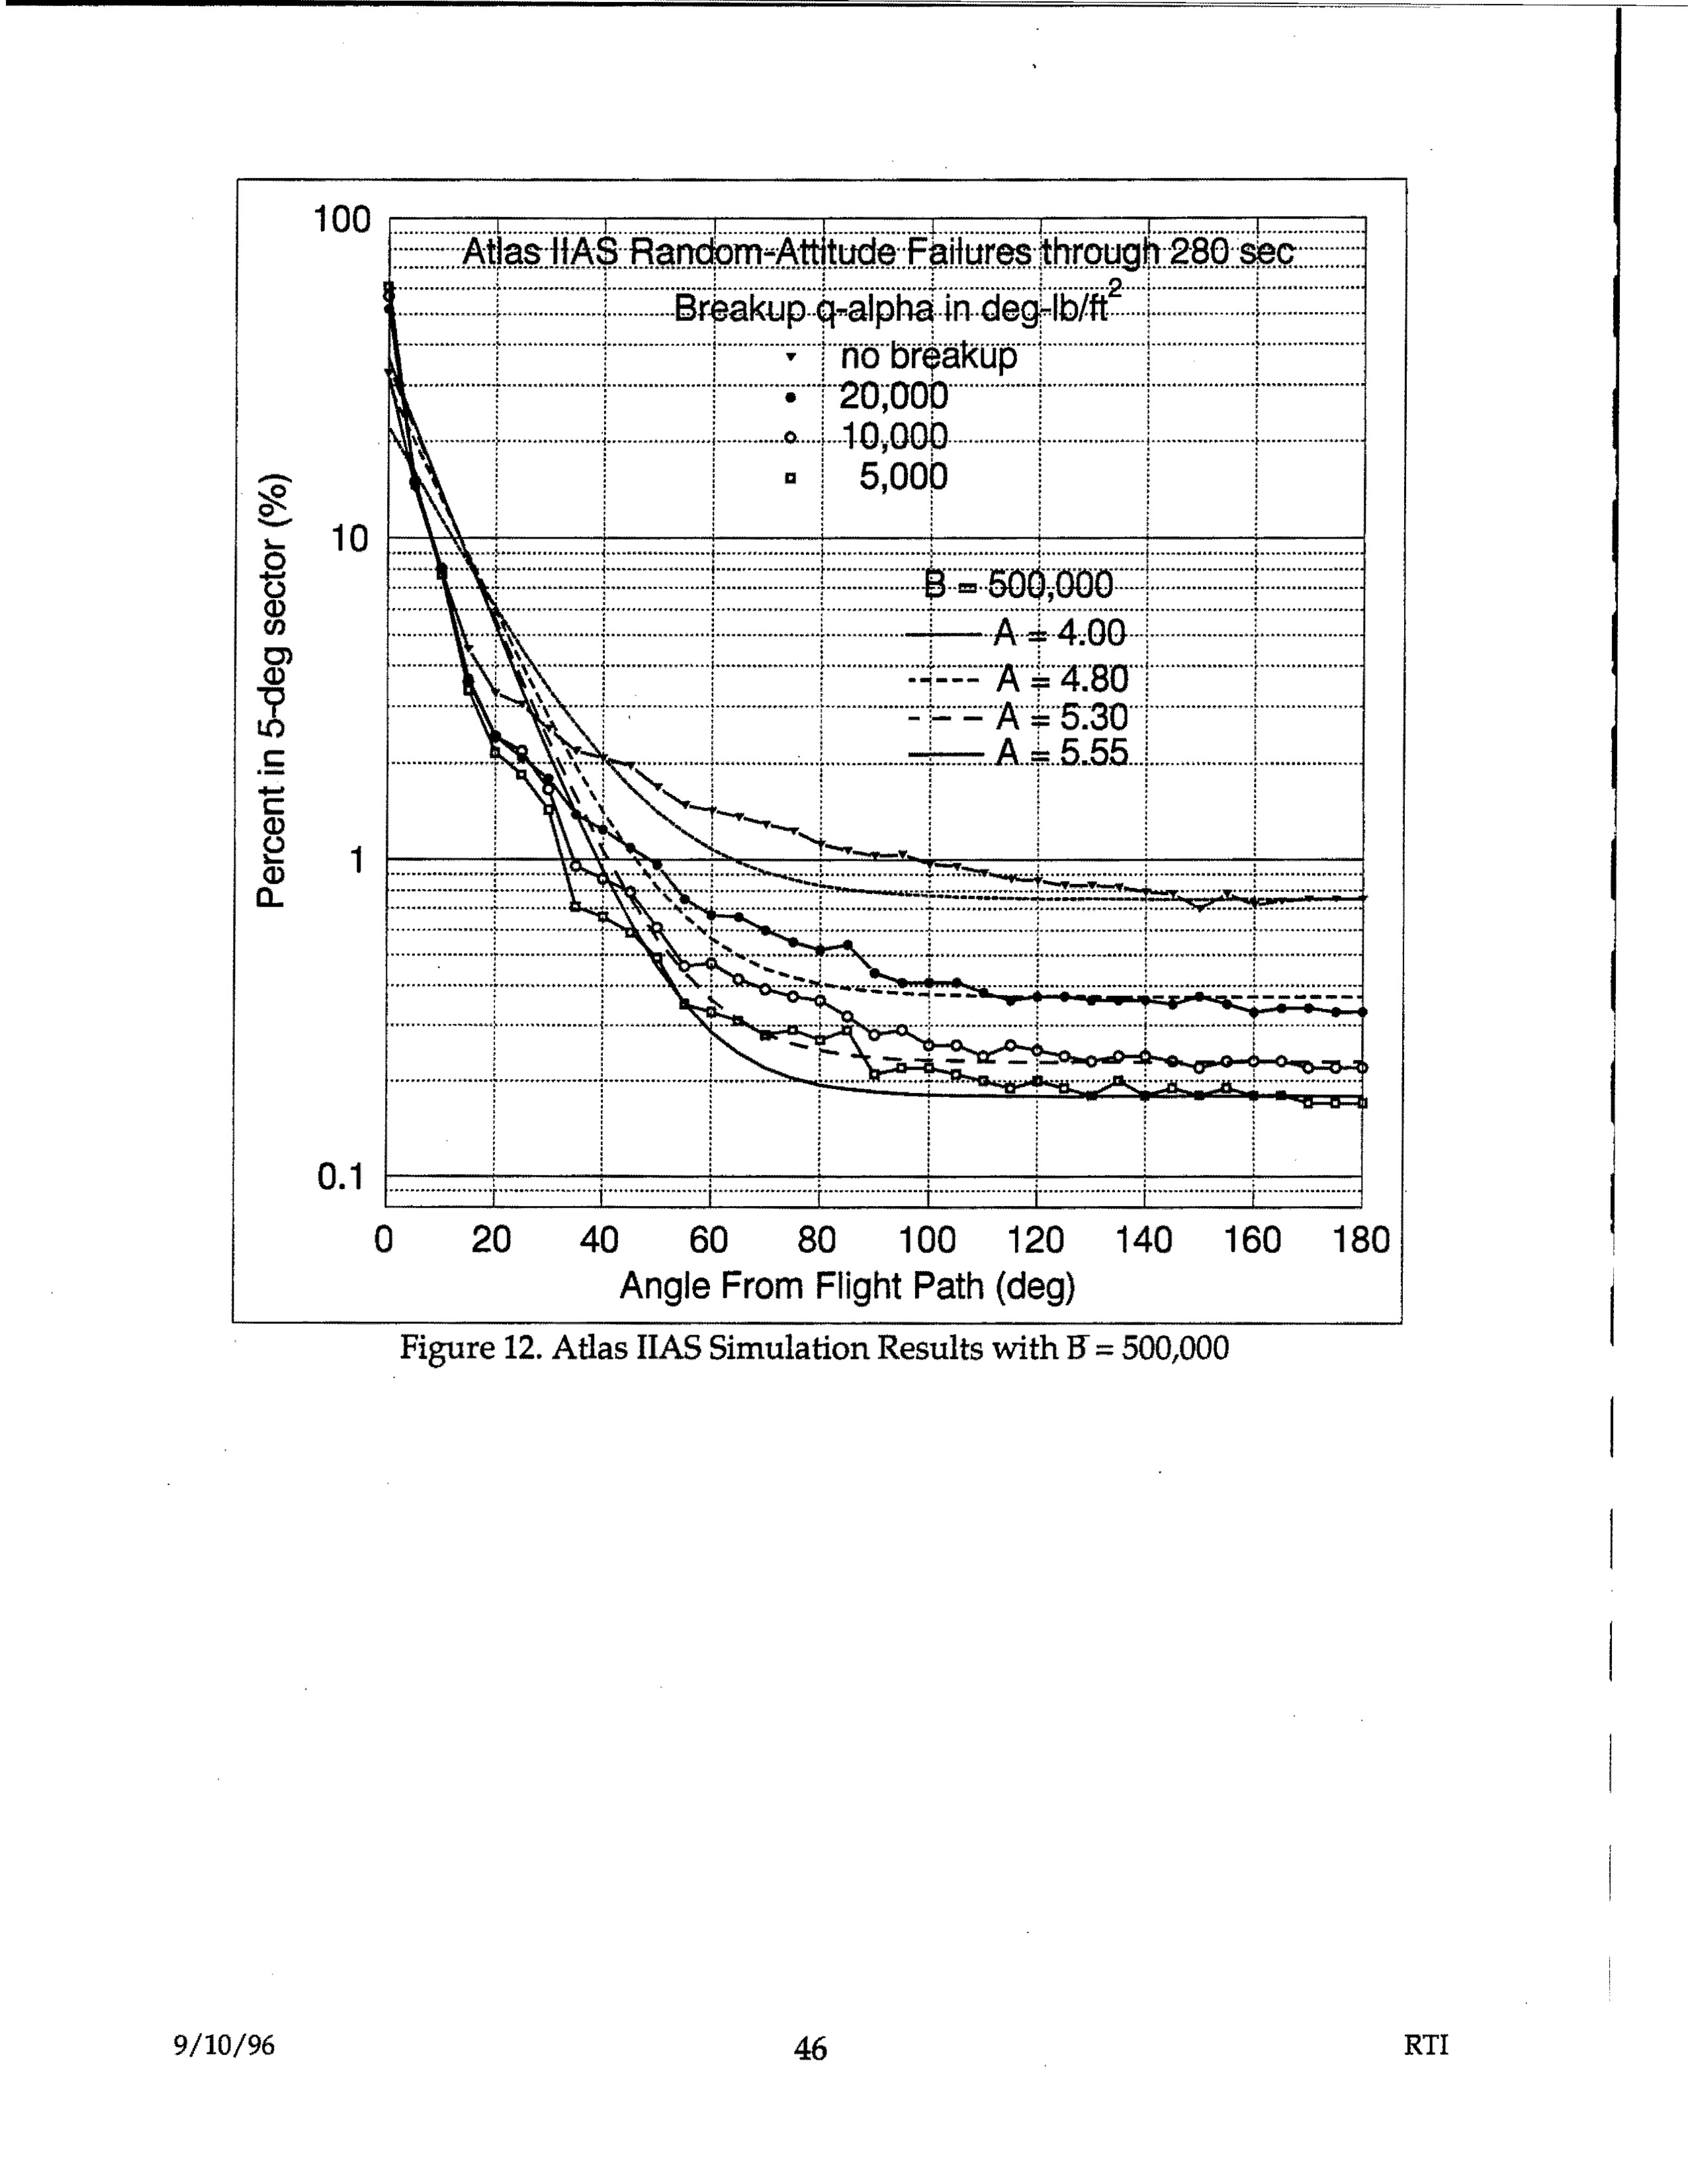
Atlas IIAS Random-Attitude Failures through 280 sec - Breakup q-alpha in deg-lb/ft - showing percent in 5-deg sector vs angle from flight path with various breakup values (no breakup, 20,000, 10,000, 5,000) and B=500,000 with A values 4.00, 4.80, 5.30, 5.55
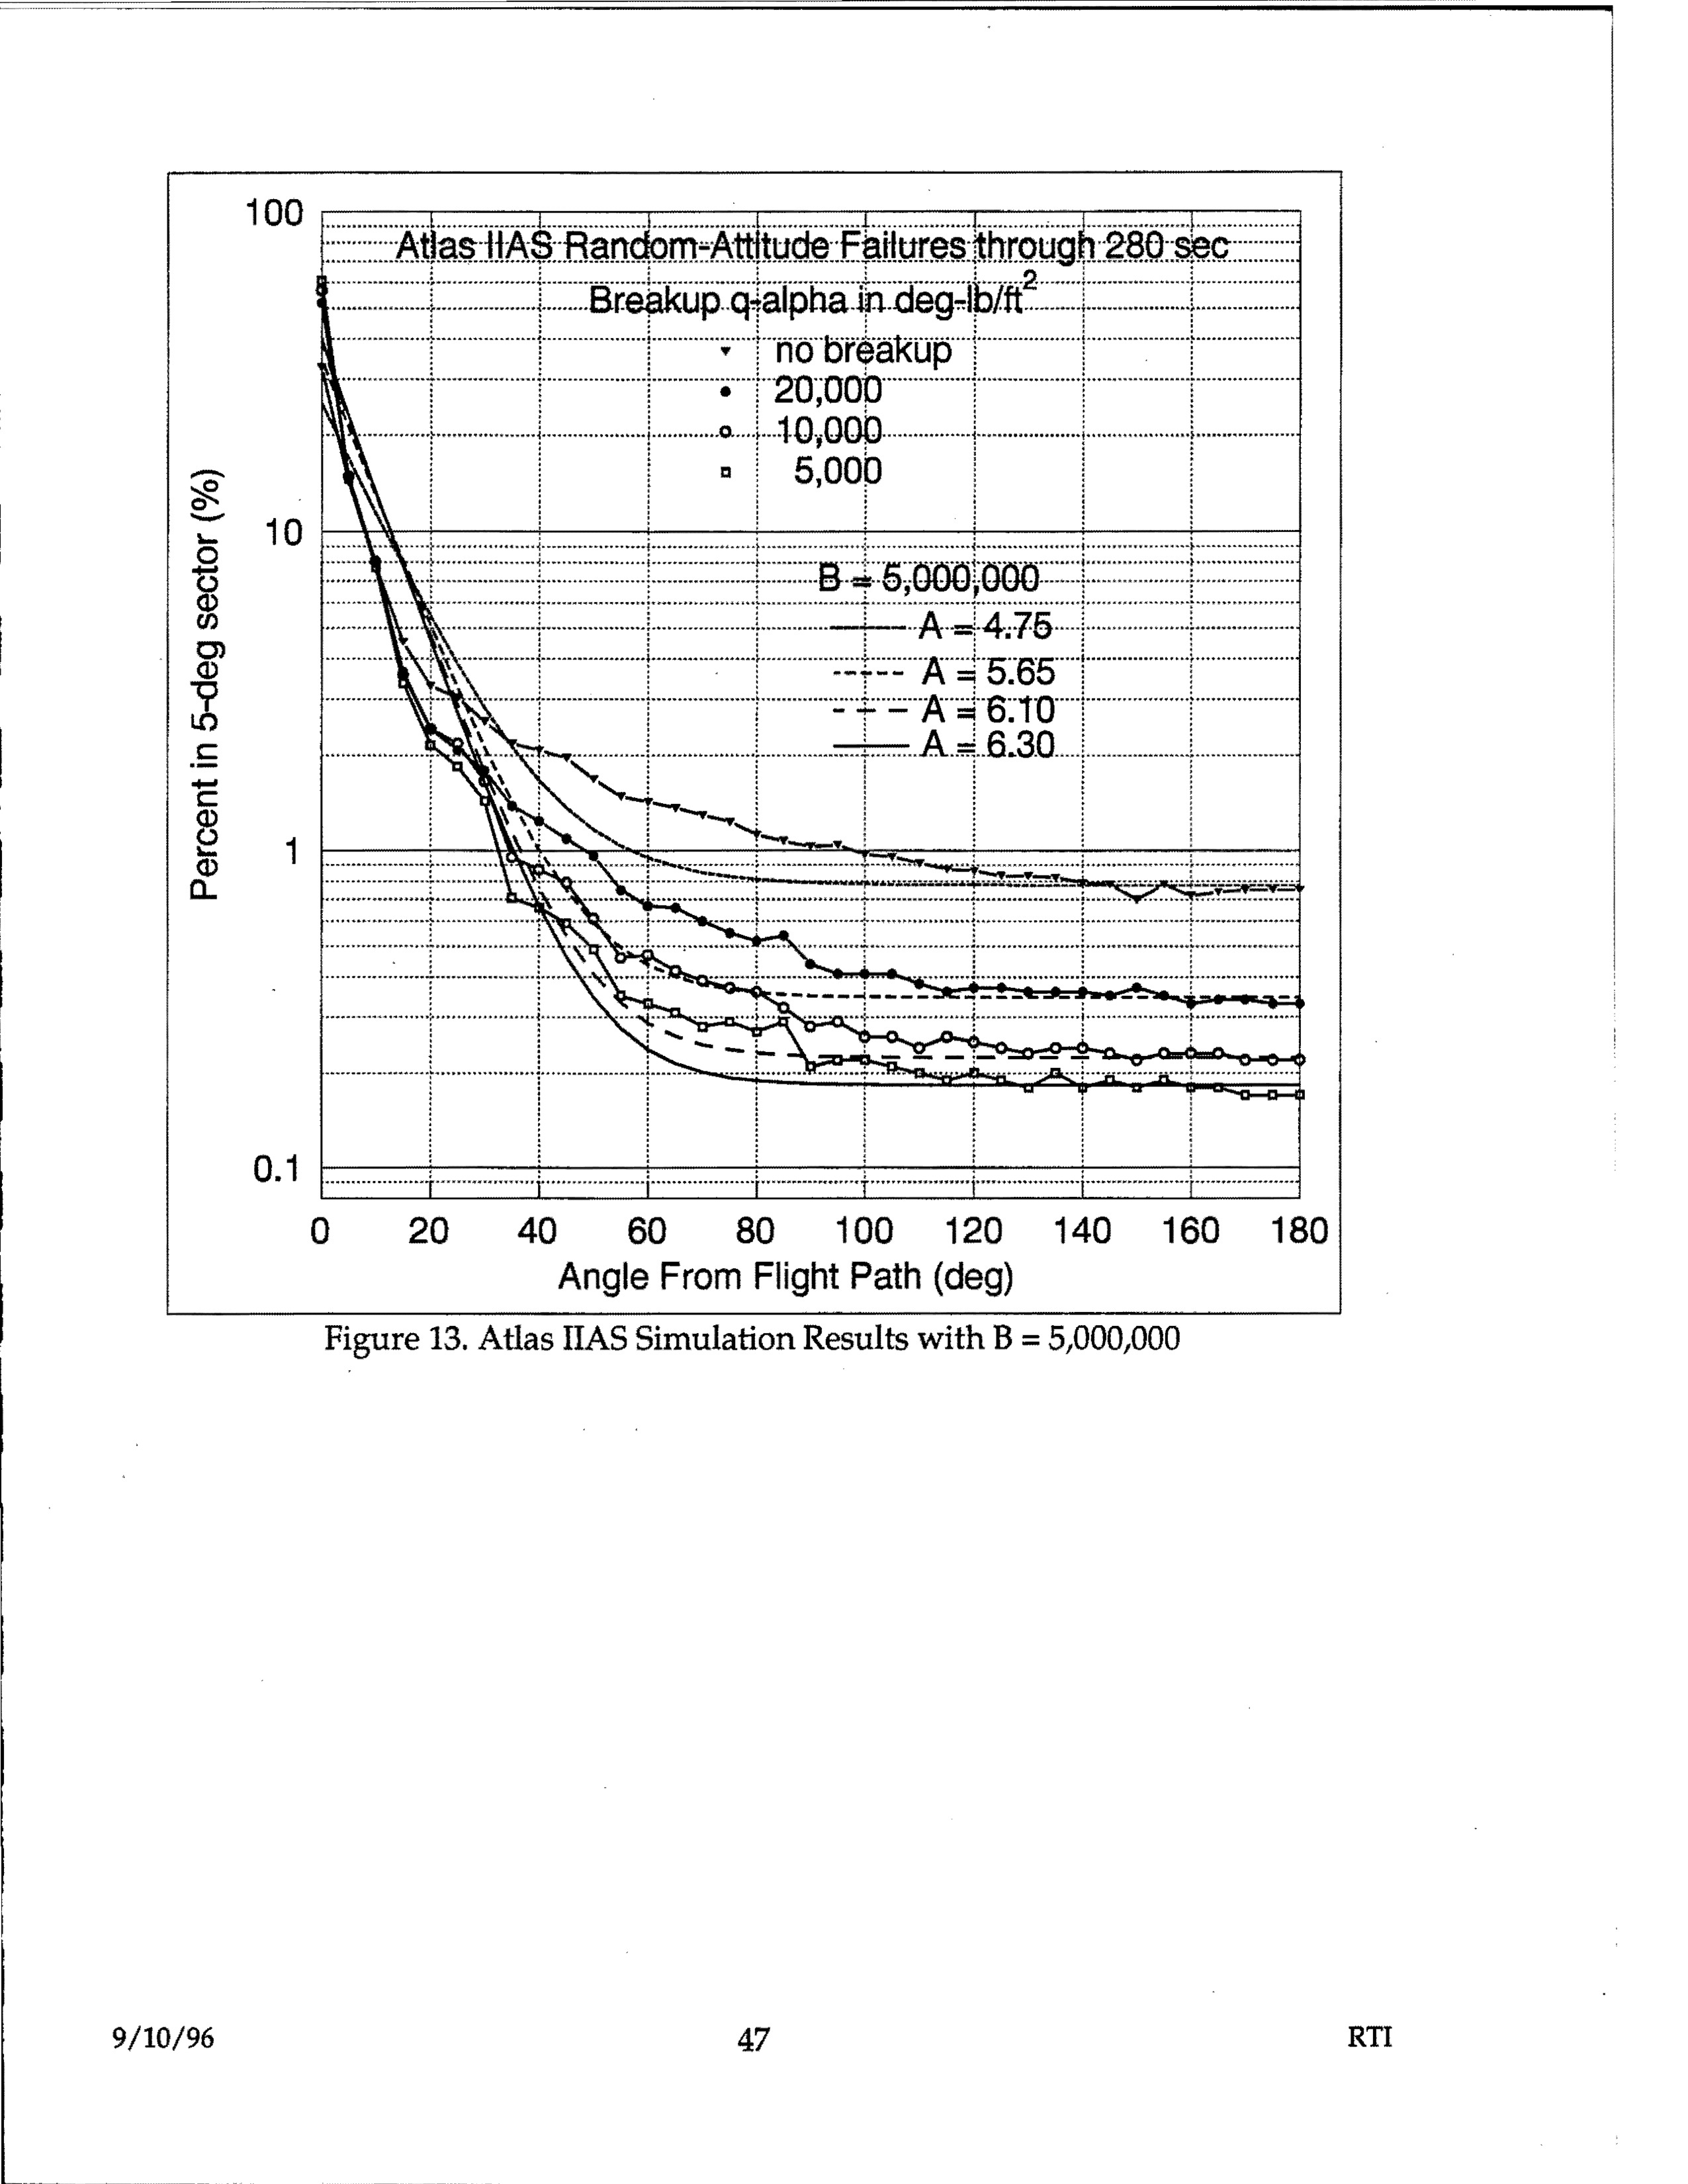
Atlas IIAS Random-Attitude Failures through 280 sec, Breakup q-alpha in deg-lb/ft^2, showing percent in 5-deg sector vs angle from flight path