
DOW-UAP-D048, Department of the Air Force Report, 1996
This report describes the Modeling of Unlikely Space-Booster Failures in Risk Calculations, documenting historical launch failure modes and recommending corrective actions to address them using novel modelling techniques.
Generated from extracted text. Verify important claims against the original document.
▶ UAP Archives explainer
This video is UAP Archives editorial content based on the linked official records; it is not government footage.
Subscribe to UAP Archives on YouTube →Related documents
Files connected by shared people, places, and events — and by appearing together in our cross-document analysis.
- pdfNASA Gemini Program Filescape · africa · south america
- pdfNASA correspondence fileswashington, dc · cape canaveral · dod
- pdfNASA-UAP-D018, Gemini 4 Experiment Debriefing, 1967florida · usaf · dod
- pdfNASA Mercury Program file, likely a transcript of John Glenn's debriefing after the Friendship 7 (MA-6) mission.cape canaveral · africa · florida
- pdfNASA Gemini Program Filescape · florida · dod
- pdfNASA-UAP-D019, Gemini 5 Technical Debriefing, Part I, 1965cape · africa · florida
Extracted images
Images flagged by the classifier as photographs, maps or sketches.

RTI logo
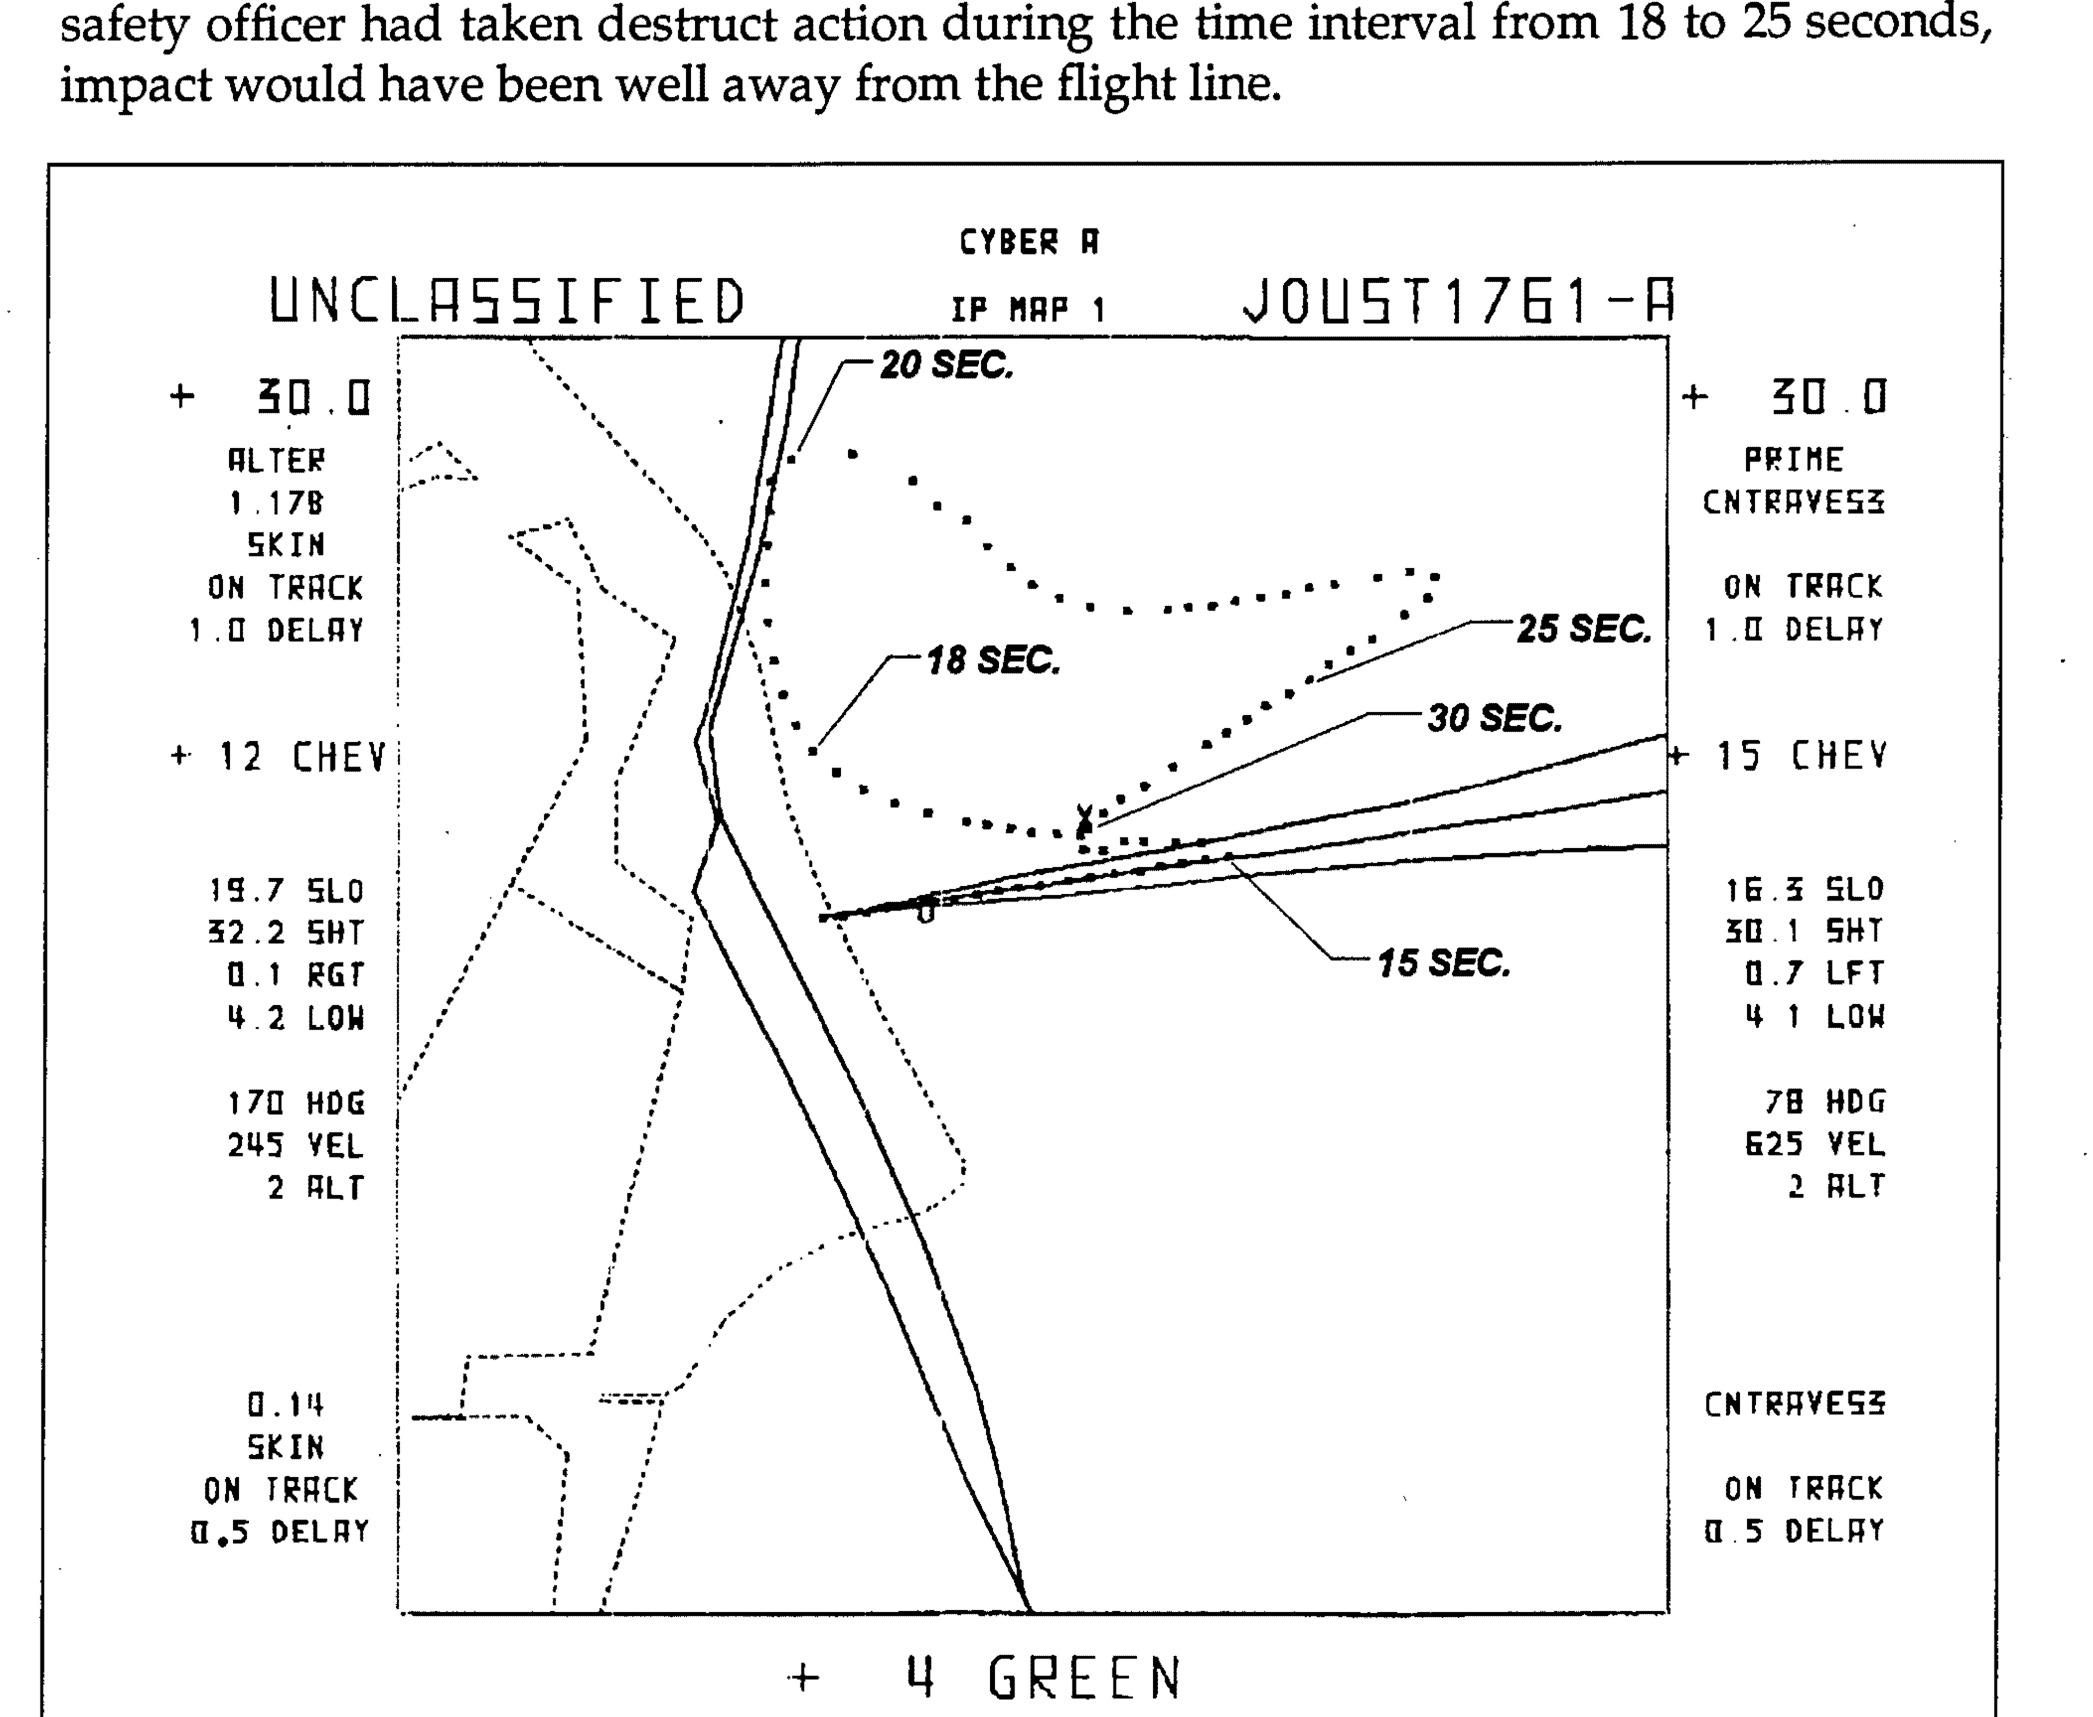
Figure 1. Joust Impact Trace Showing a Mode-5 Failure Response - UNCLASSIFIED CYBER H IP MAP 1 JOUST1761-A diagram showing trajectory traces at various time intervals (18 SEC, 20 SEC, 25 SEC, 30 SEC) with technical parameters including altitude, velocity, and track data
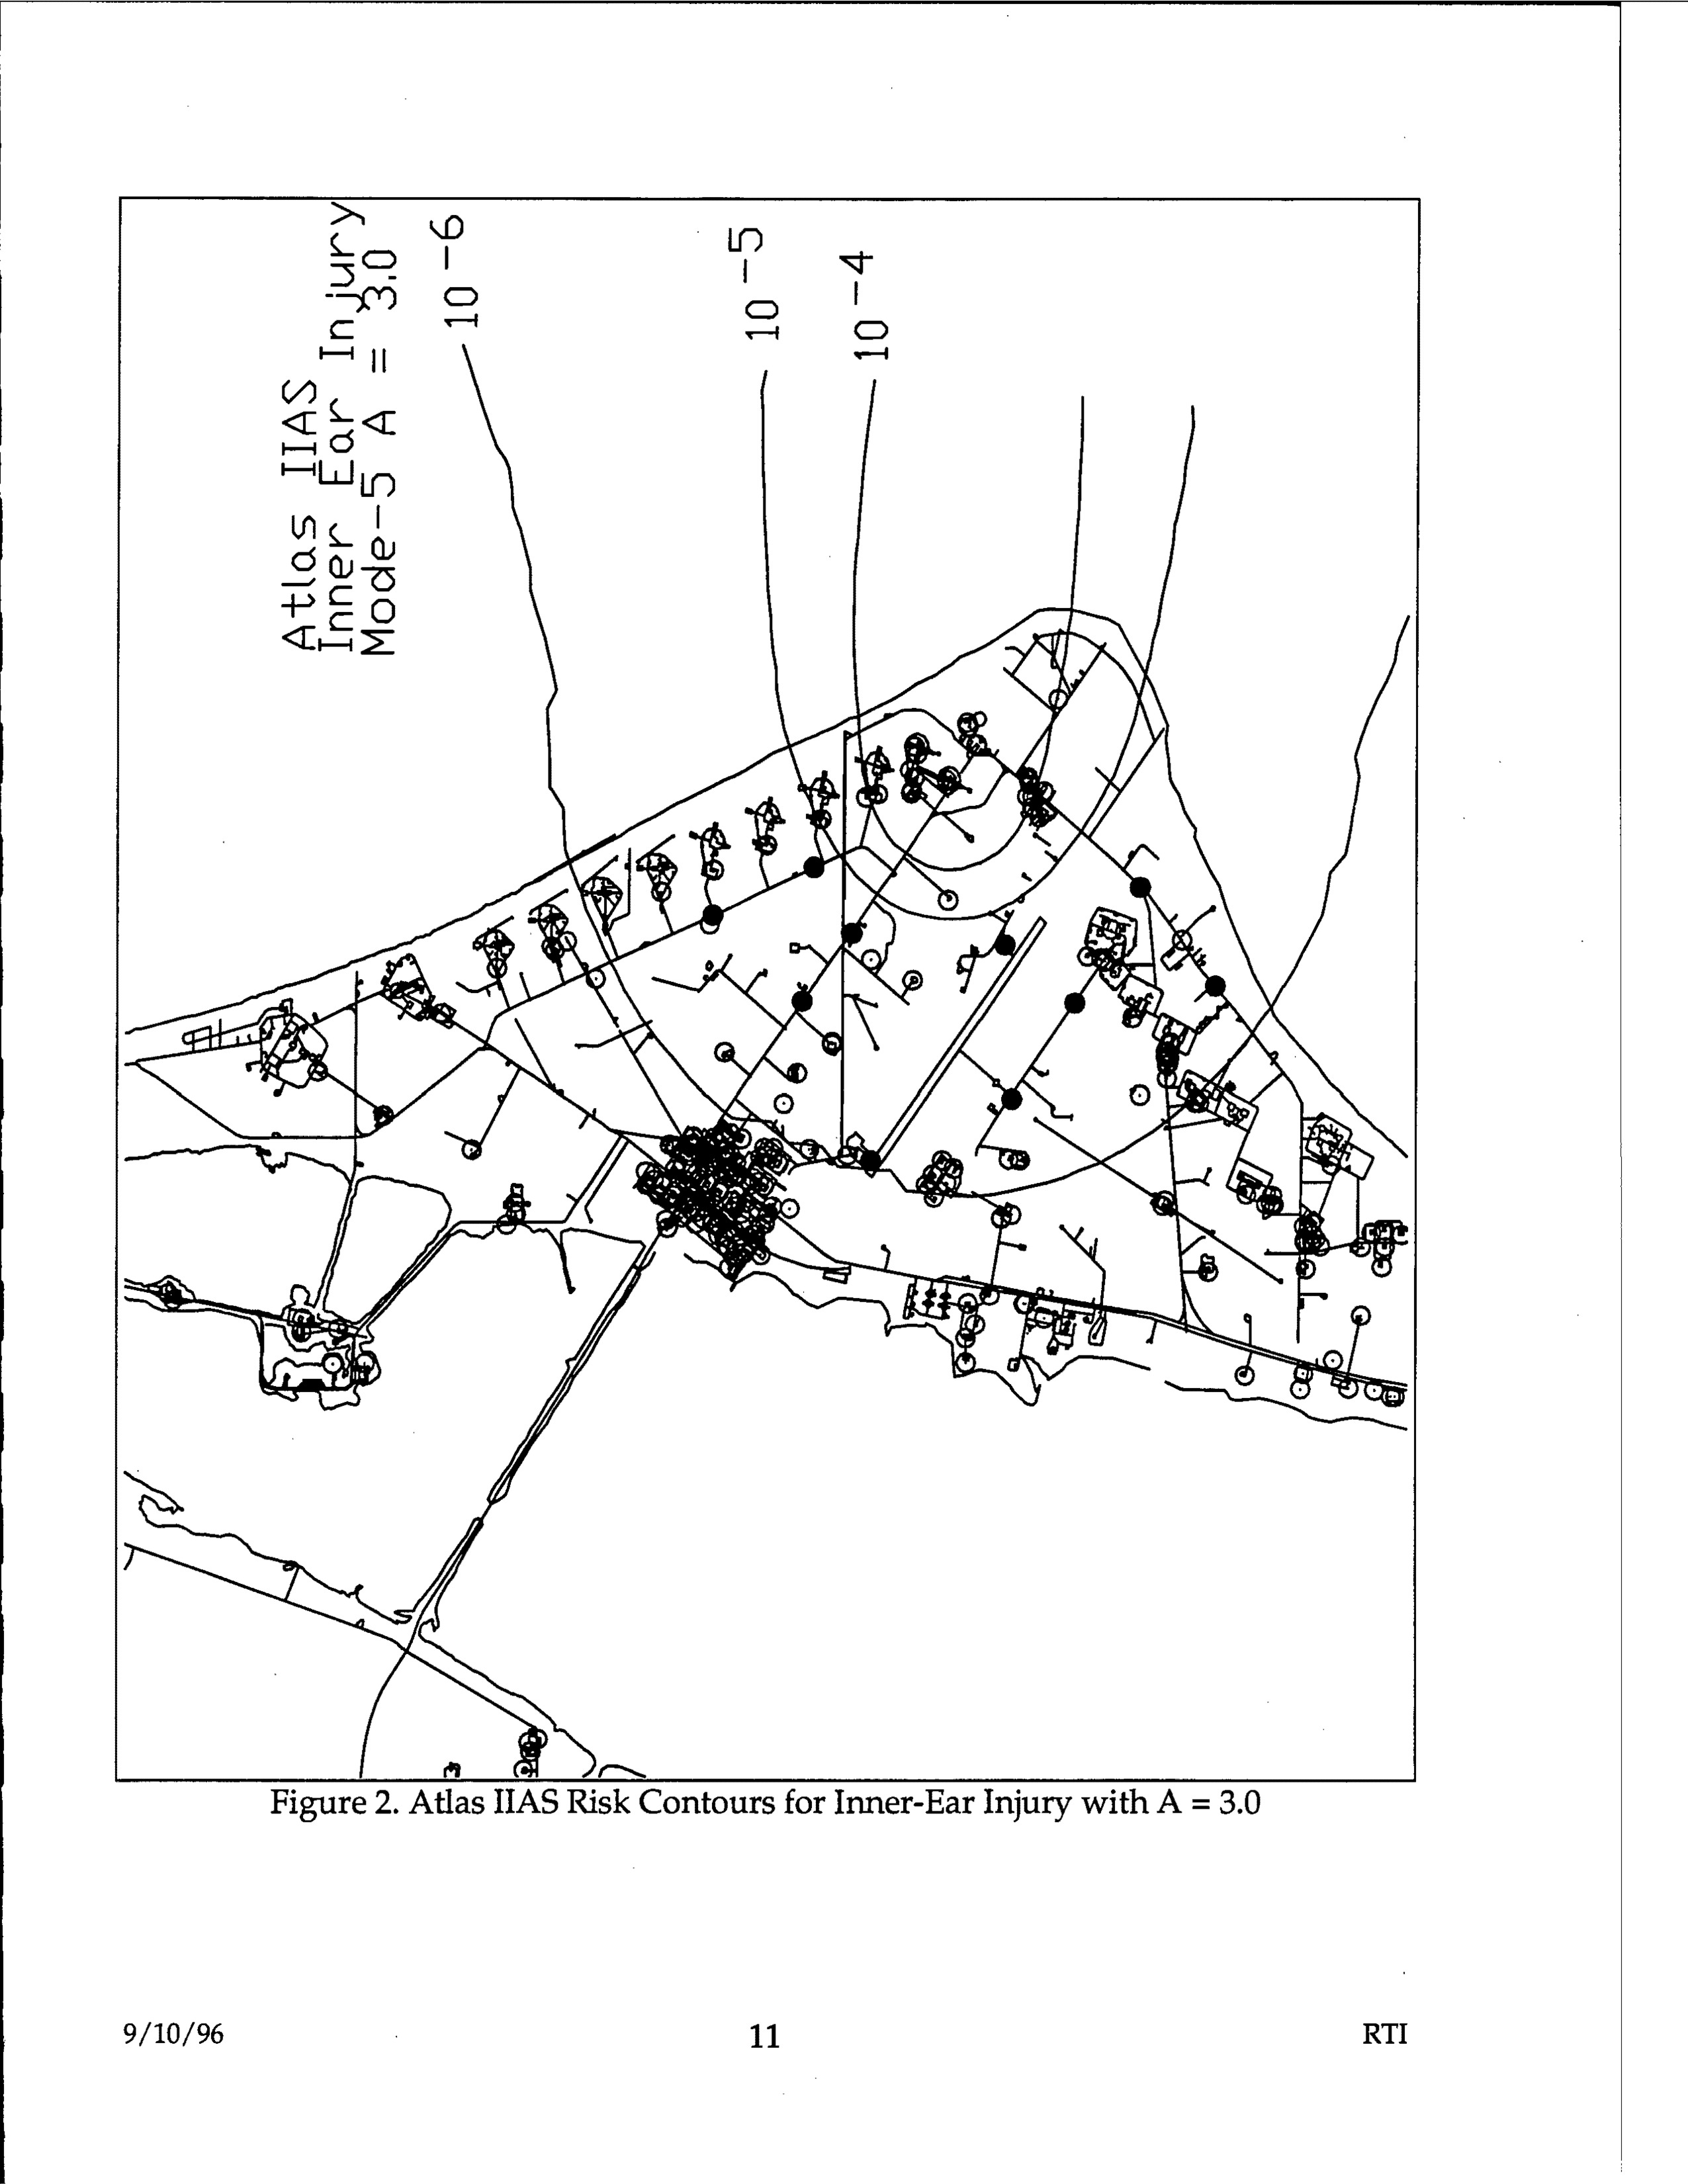
Atlas IIAS risk contours map showing inner-ear injury zones with concentric circles marked 10^-6, 10^-5, and 10^-4, with Mode-5A notation and A=3.0 parameter
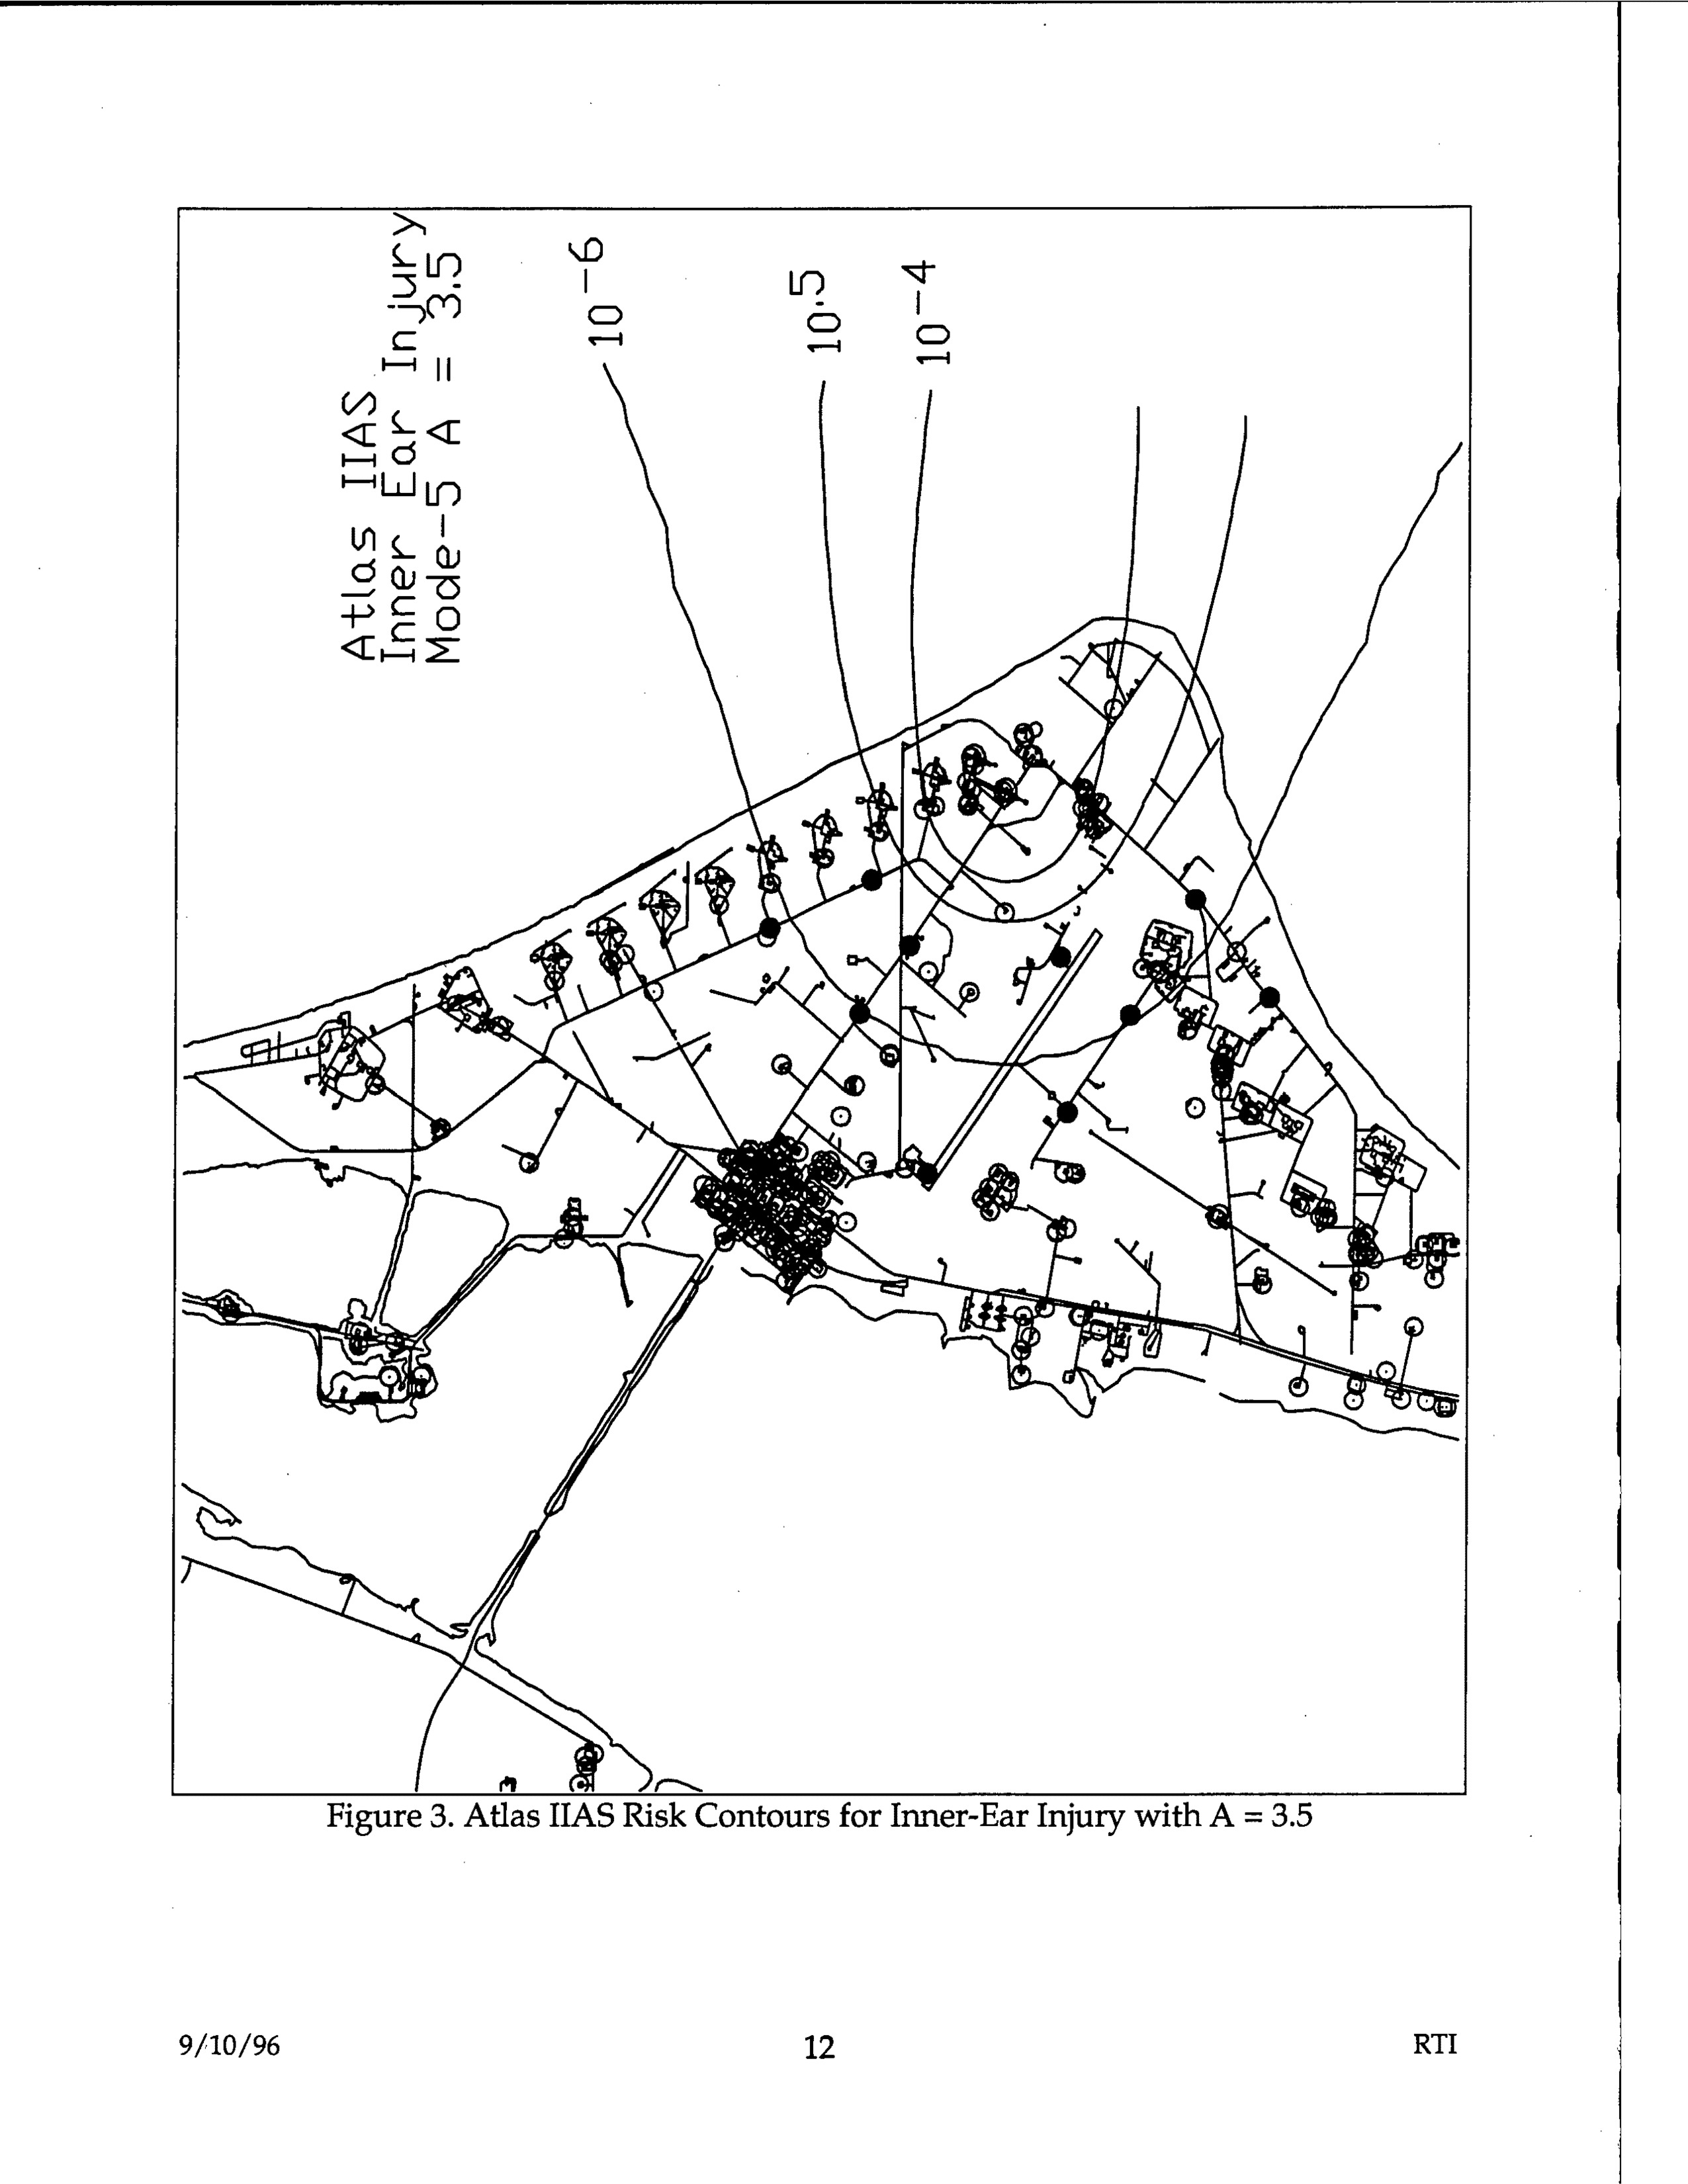
Figure 3. Atlas IIAS Risk Contours for Inner-Ear Injury with A = 3.5
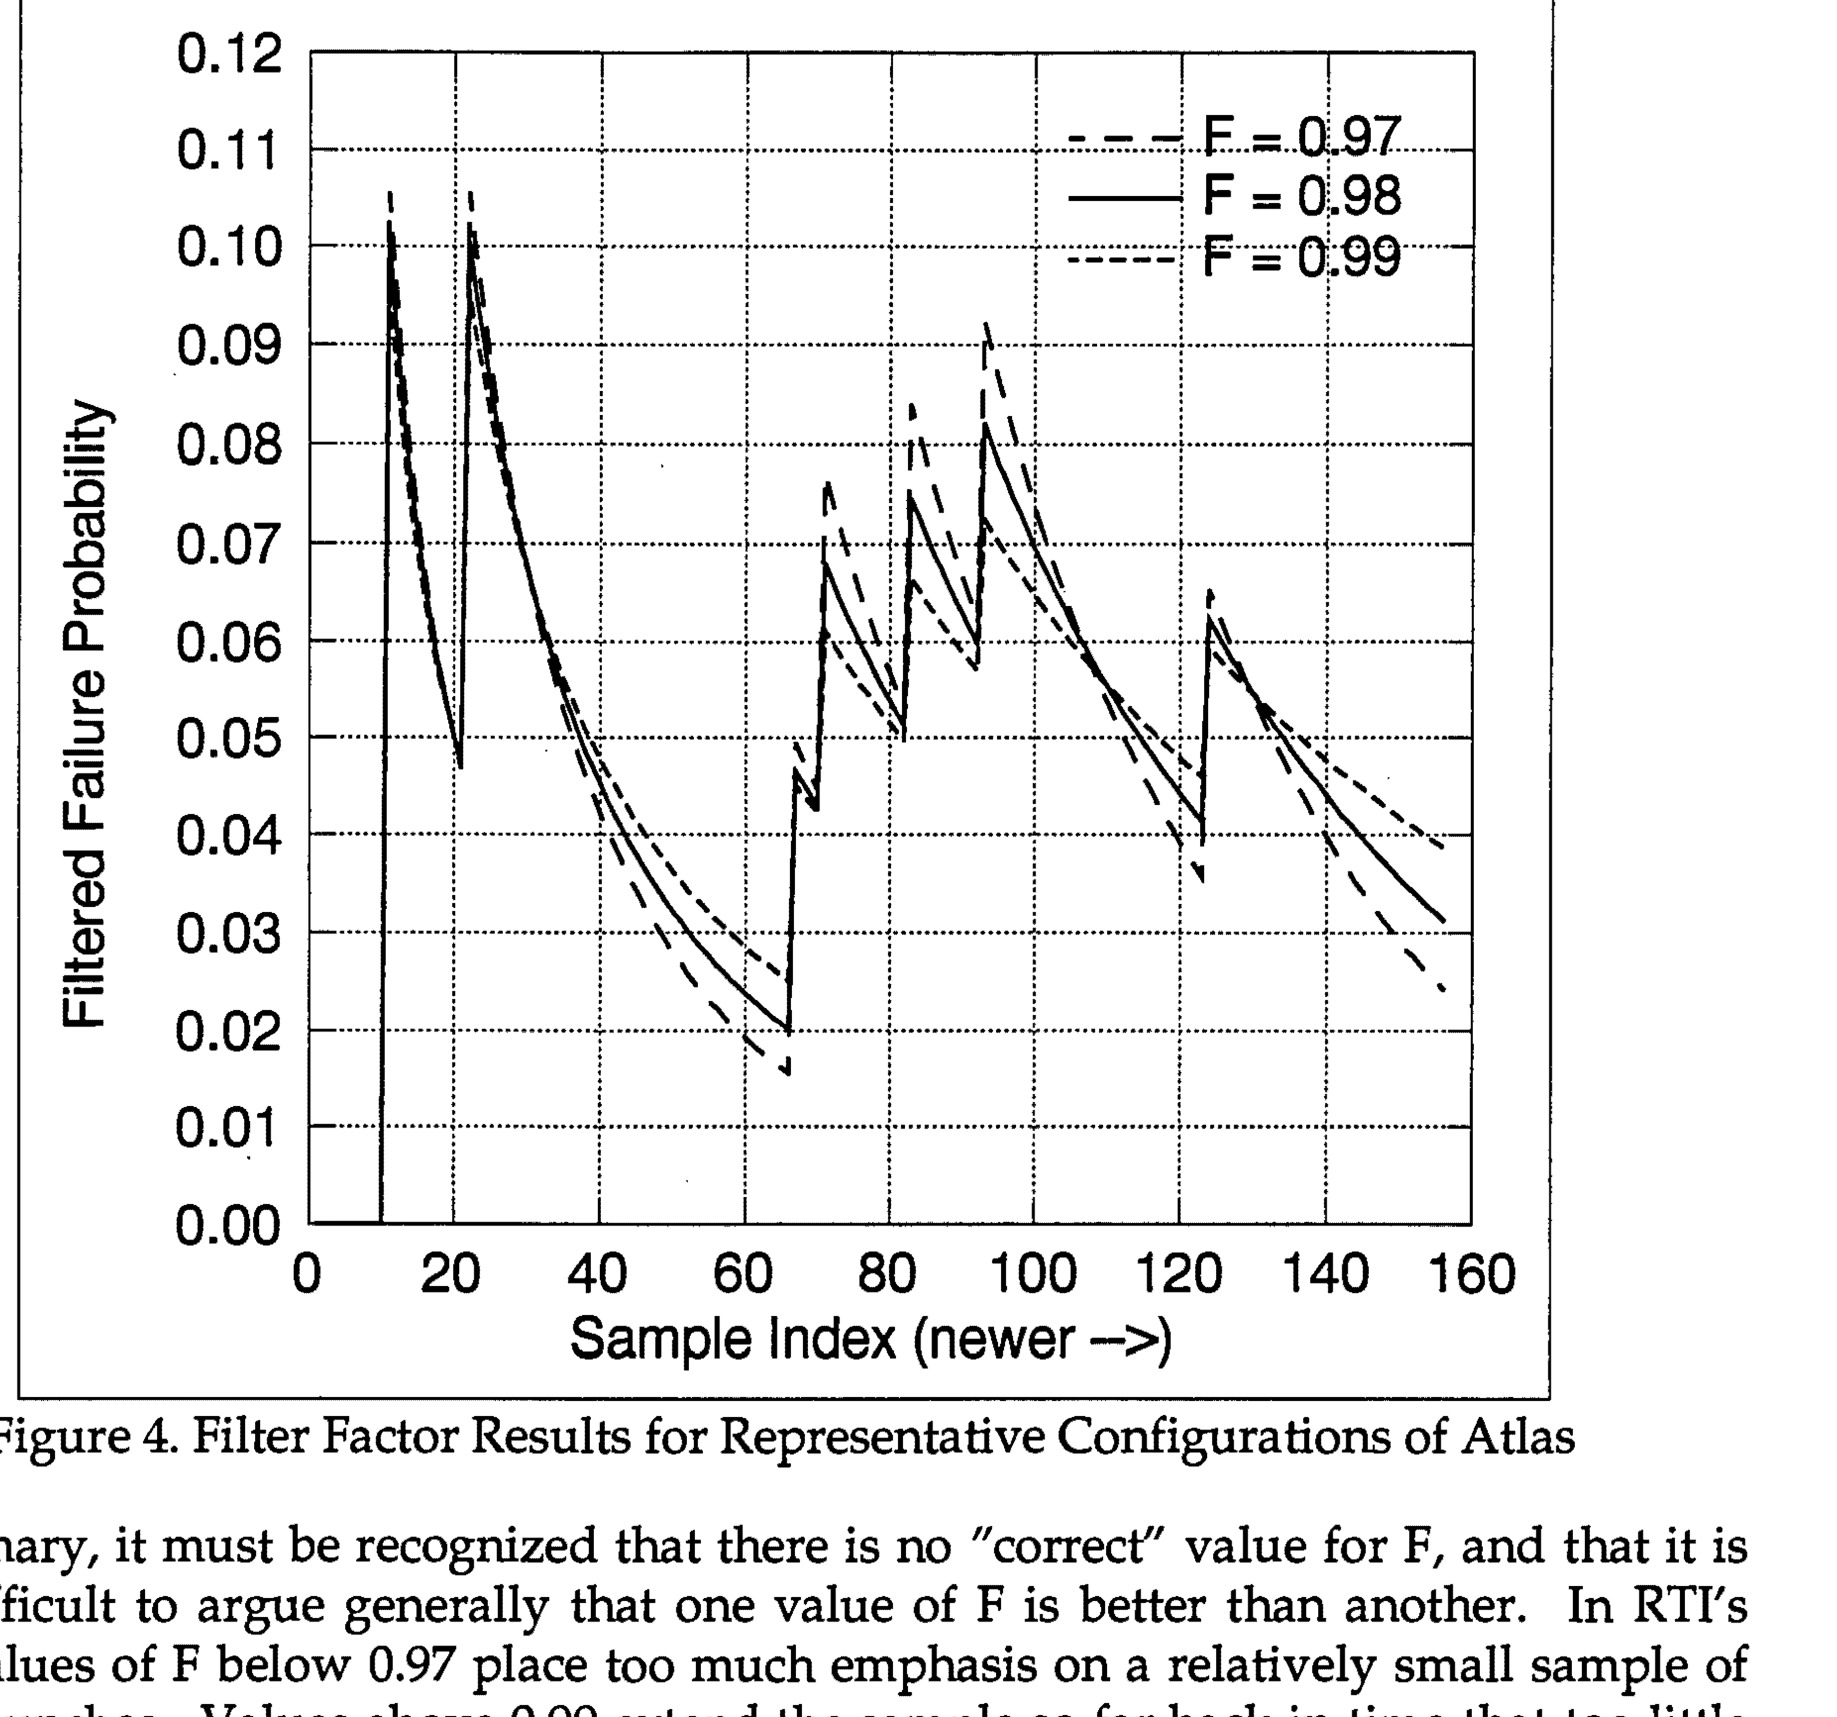
Filter Factor Results for Representative Configurations of Atlas
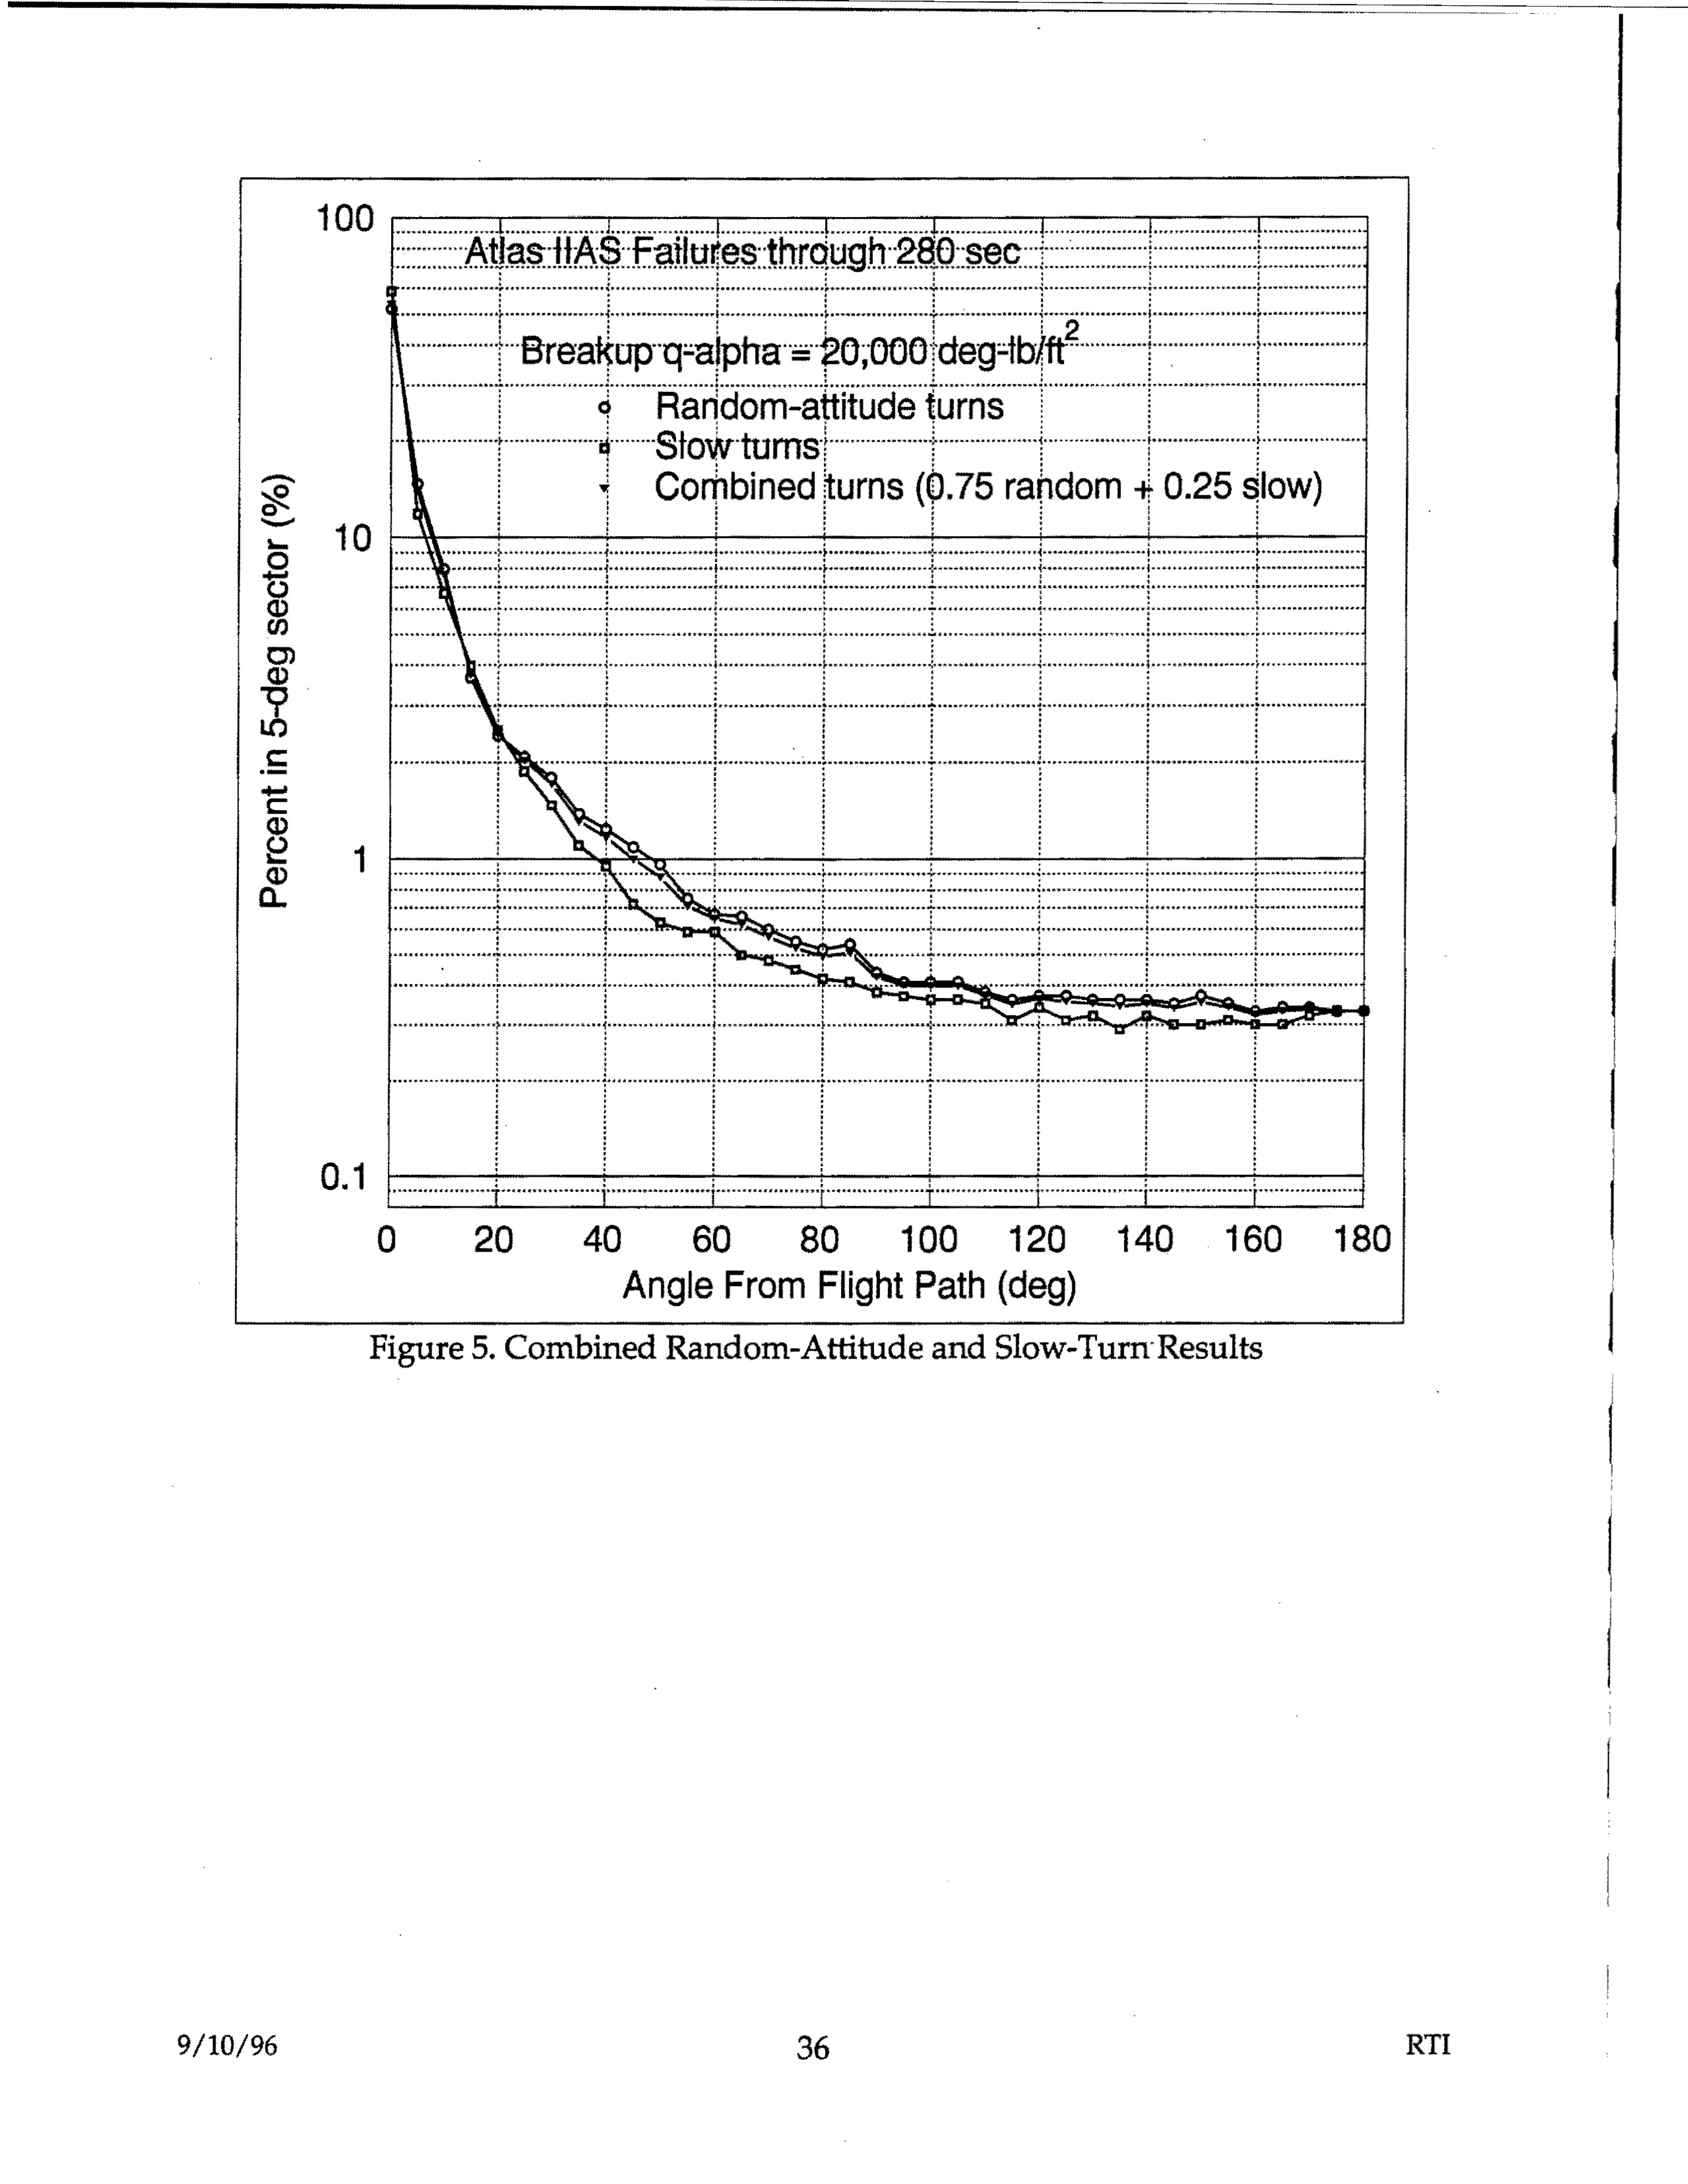
Atlas IIAS Failures through 280 sec - Breakup q-alpha = 20,000 deg-lb/ft² - Random-attitude turns, Slow turns, Combined turns (0.75 random + 0.25 slow) - Percent in 5-deg sector vs Angle From Flight Path (deg)
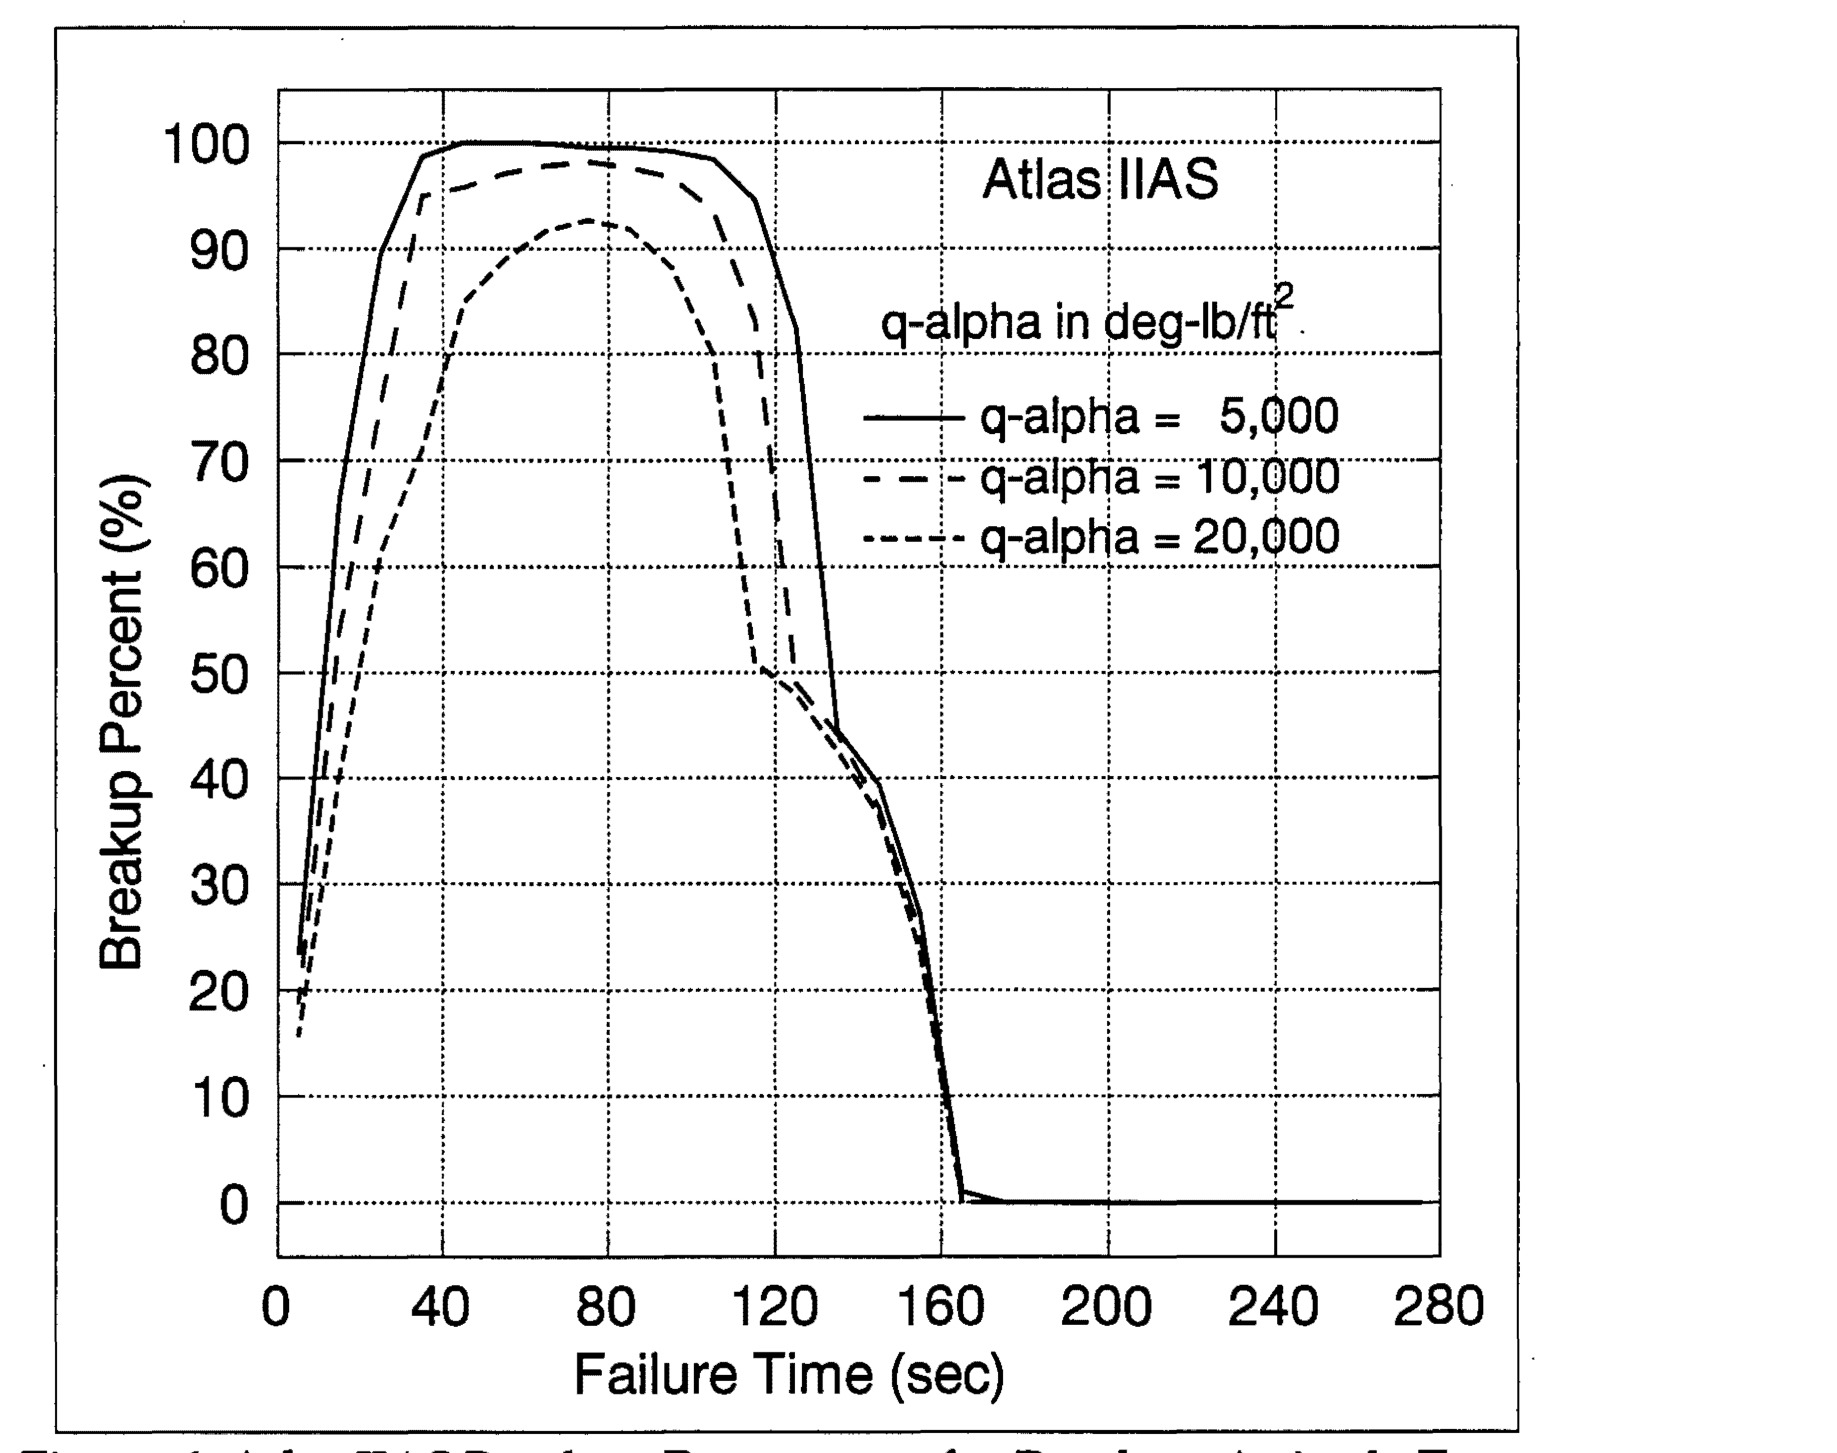
Figure 6. Atlas IIAS Breakup Percentages for Random-Attitude Turns
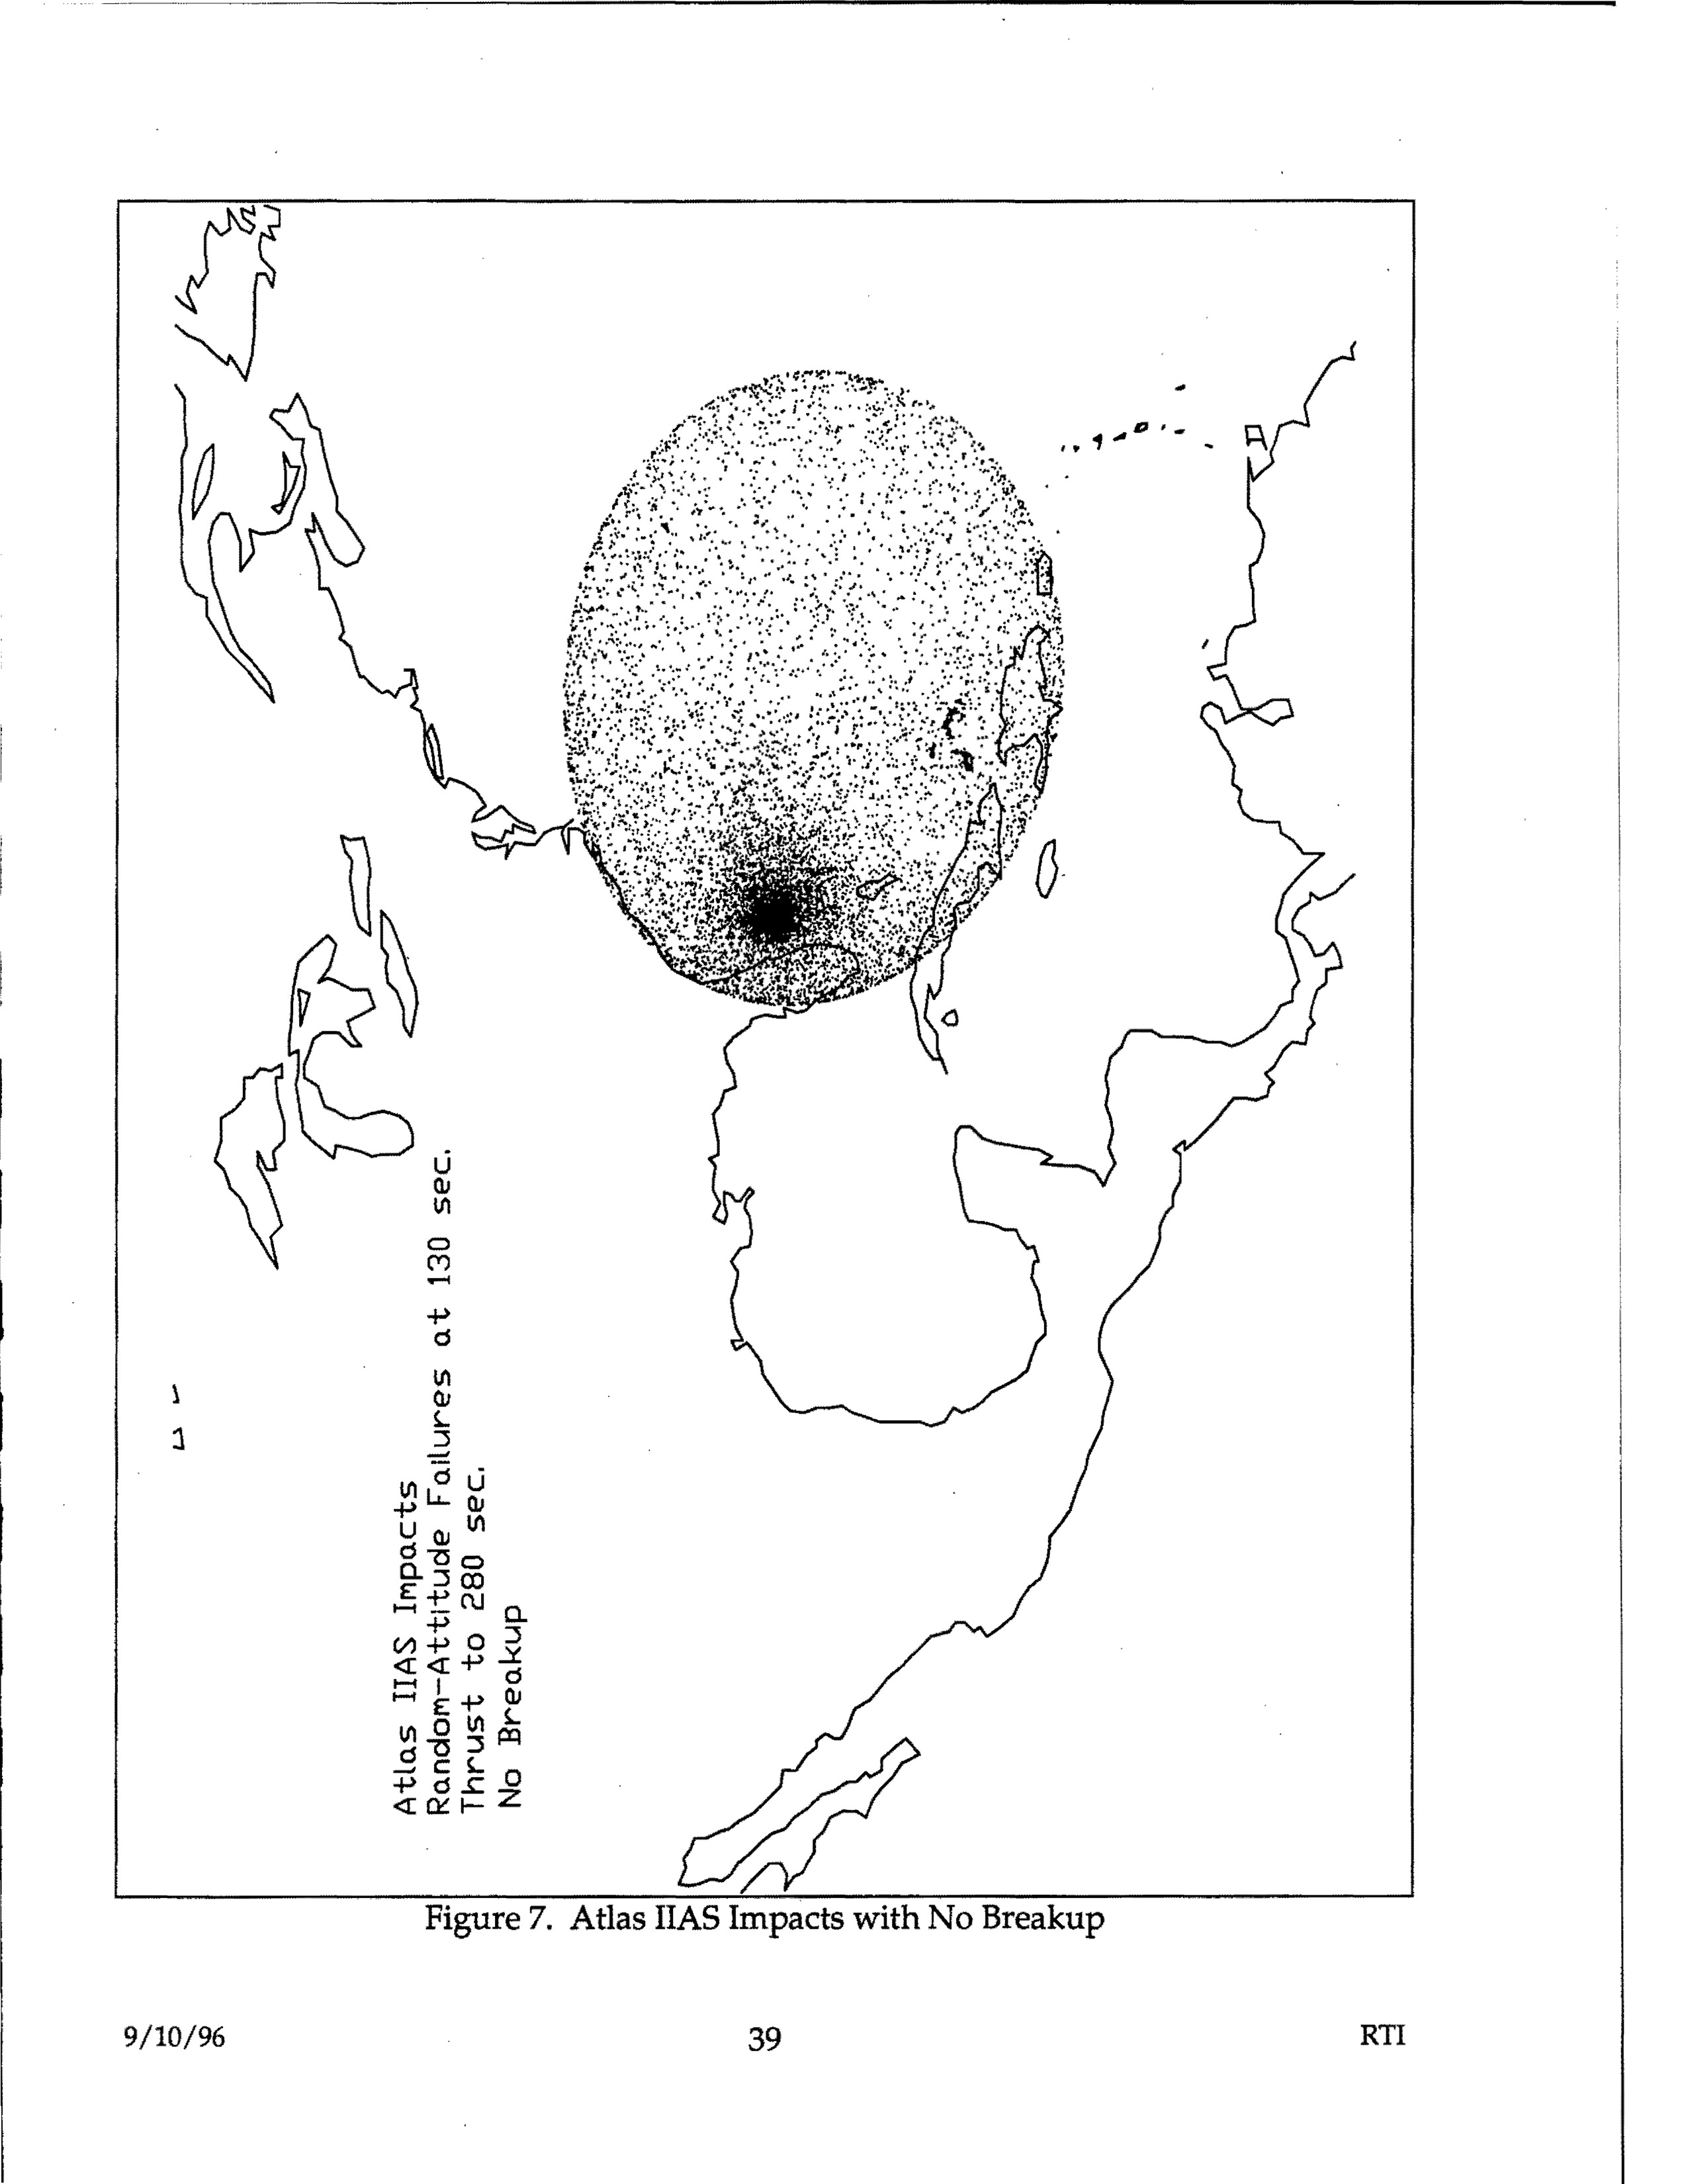
Atlas IIAS Impacts with No Breakup - map showing random-attitude failures at t30 sec thrust to 280 sec with impact footprint overlay
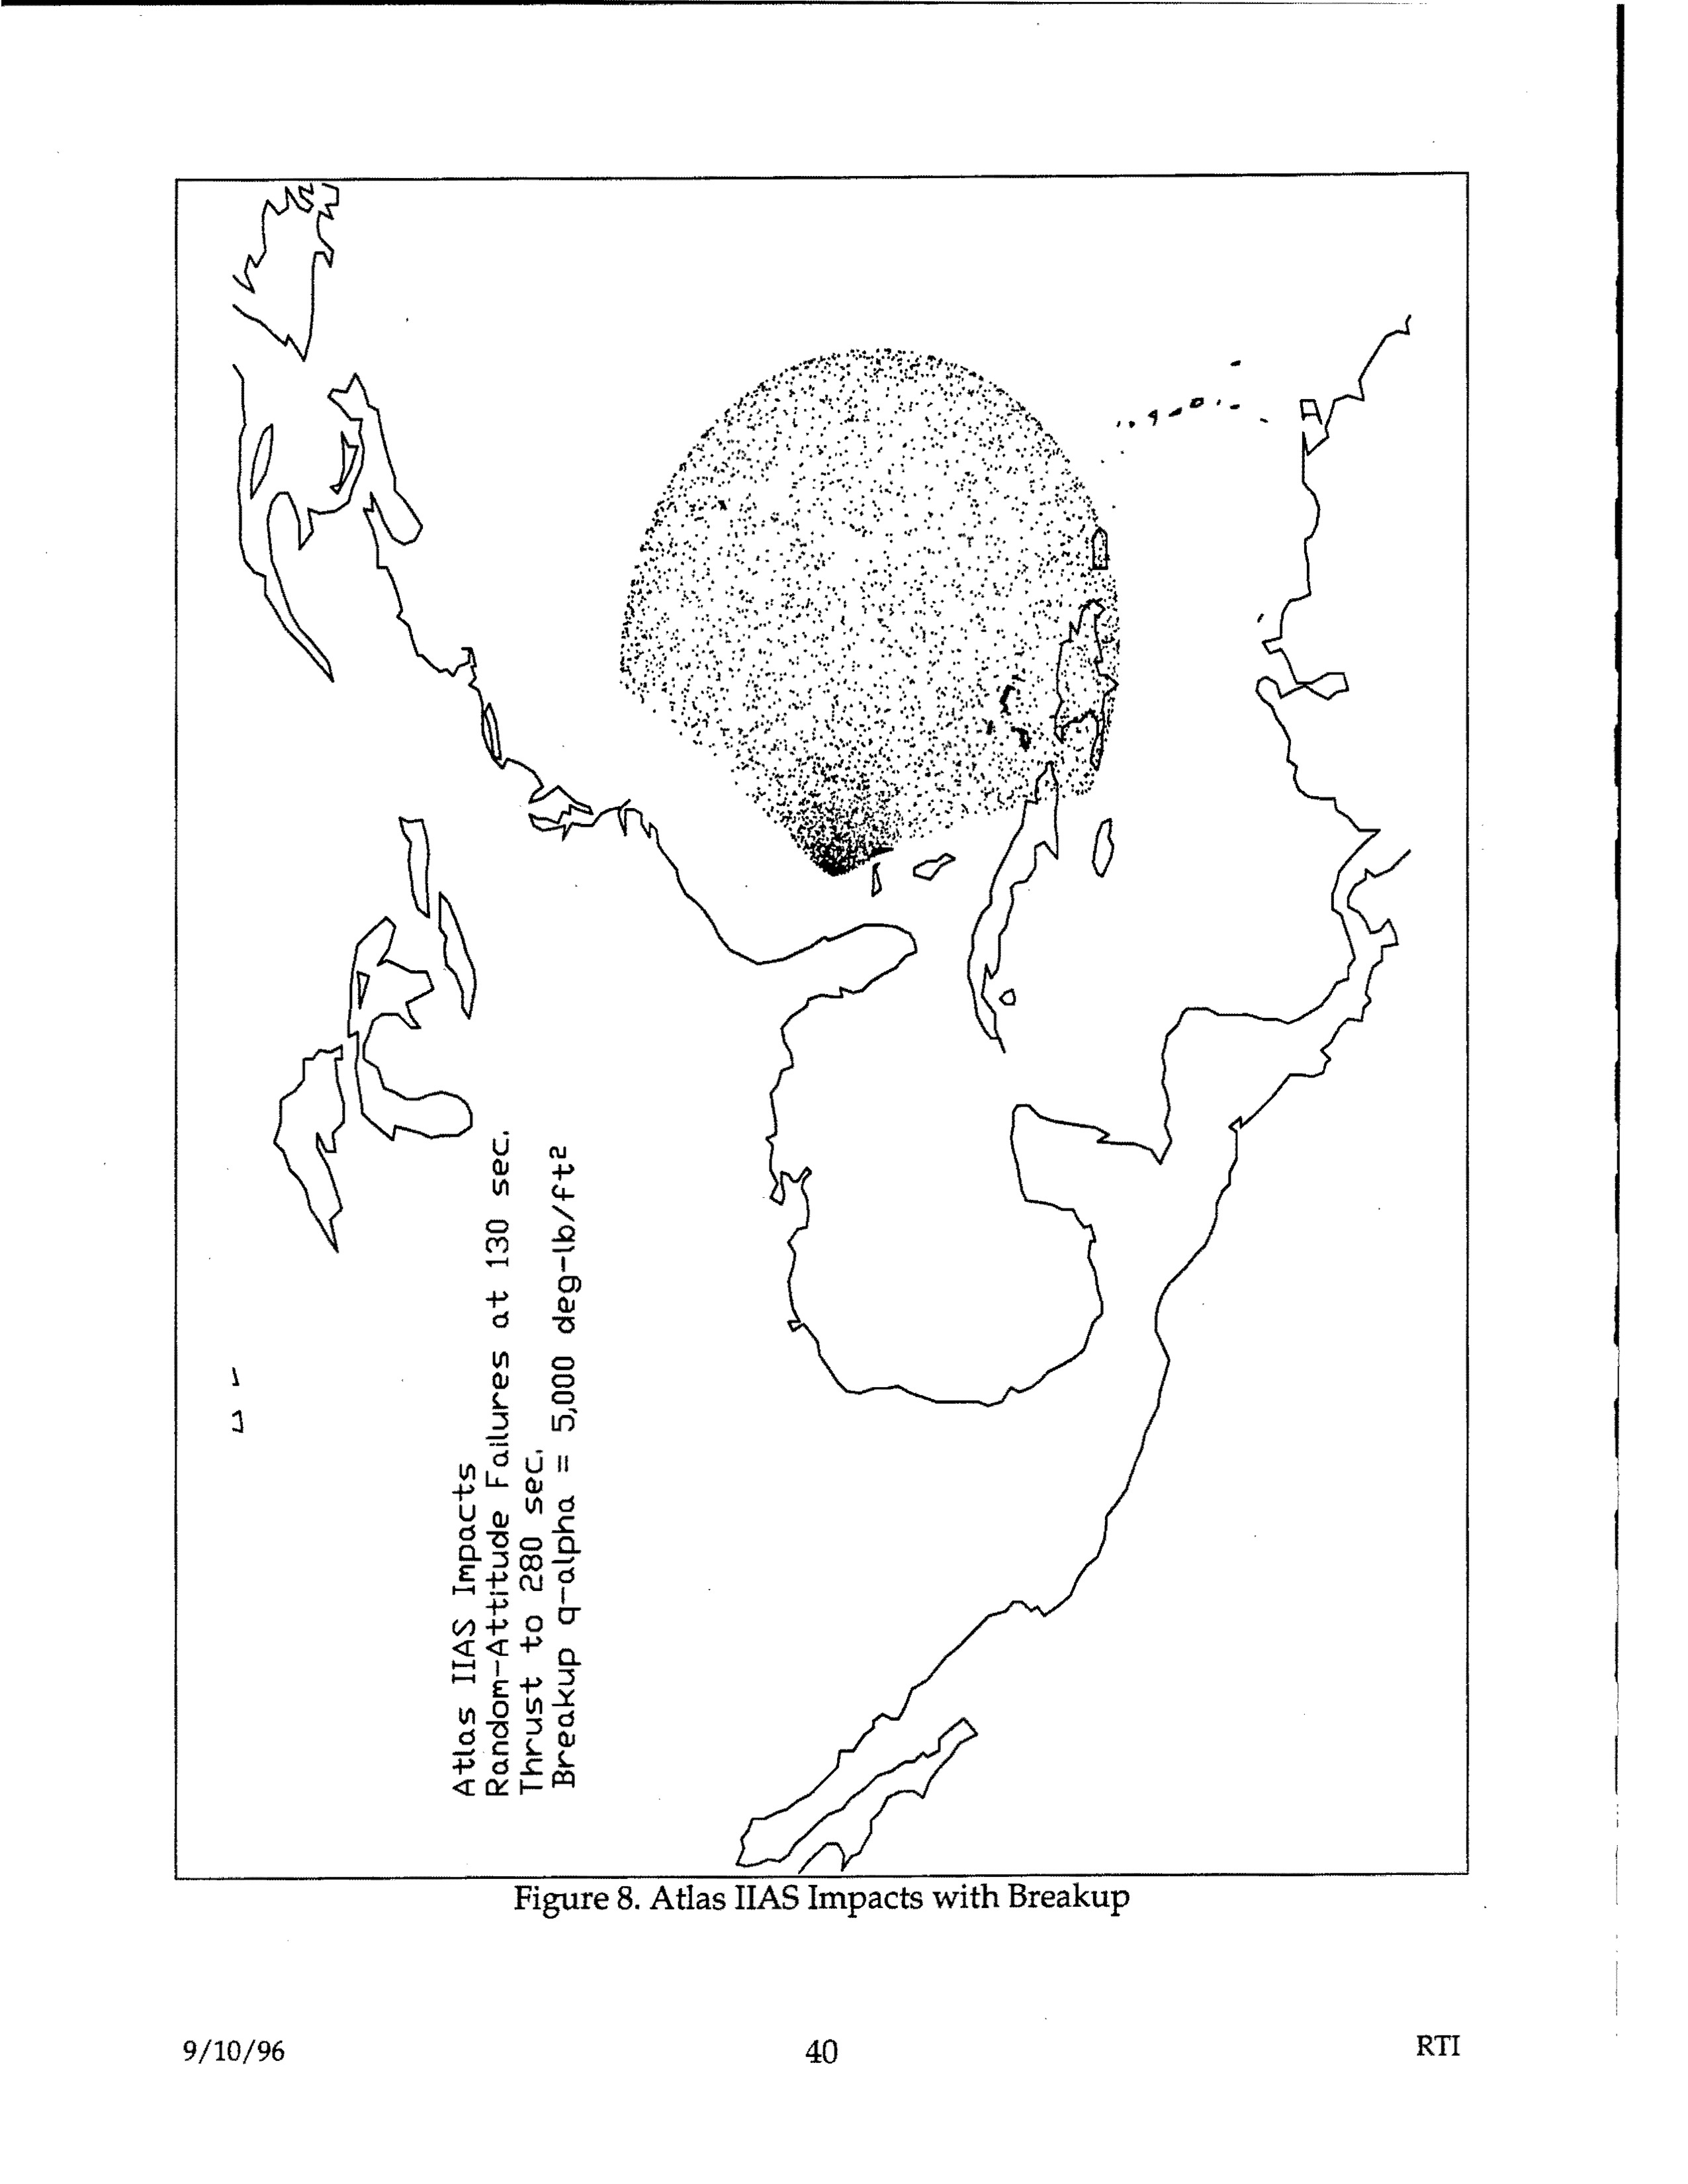
Atlas IIAS Impacts with Breakup - Random-Attitude Failures at 130 sec, Thrust to 230 sec, Breakup q-alpha = 5000 deg-lb/ft²
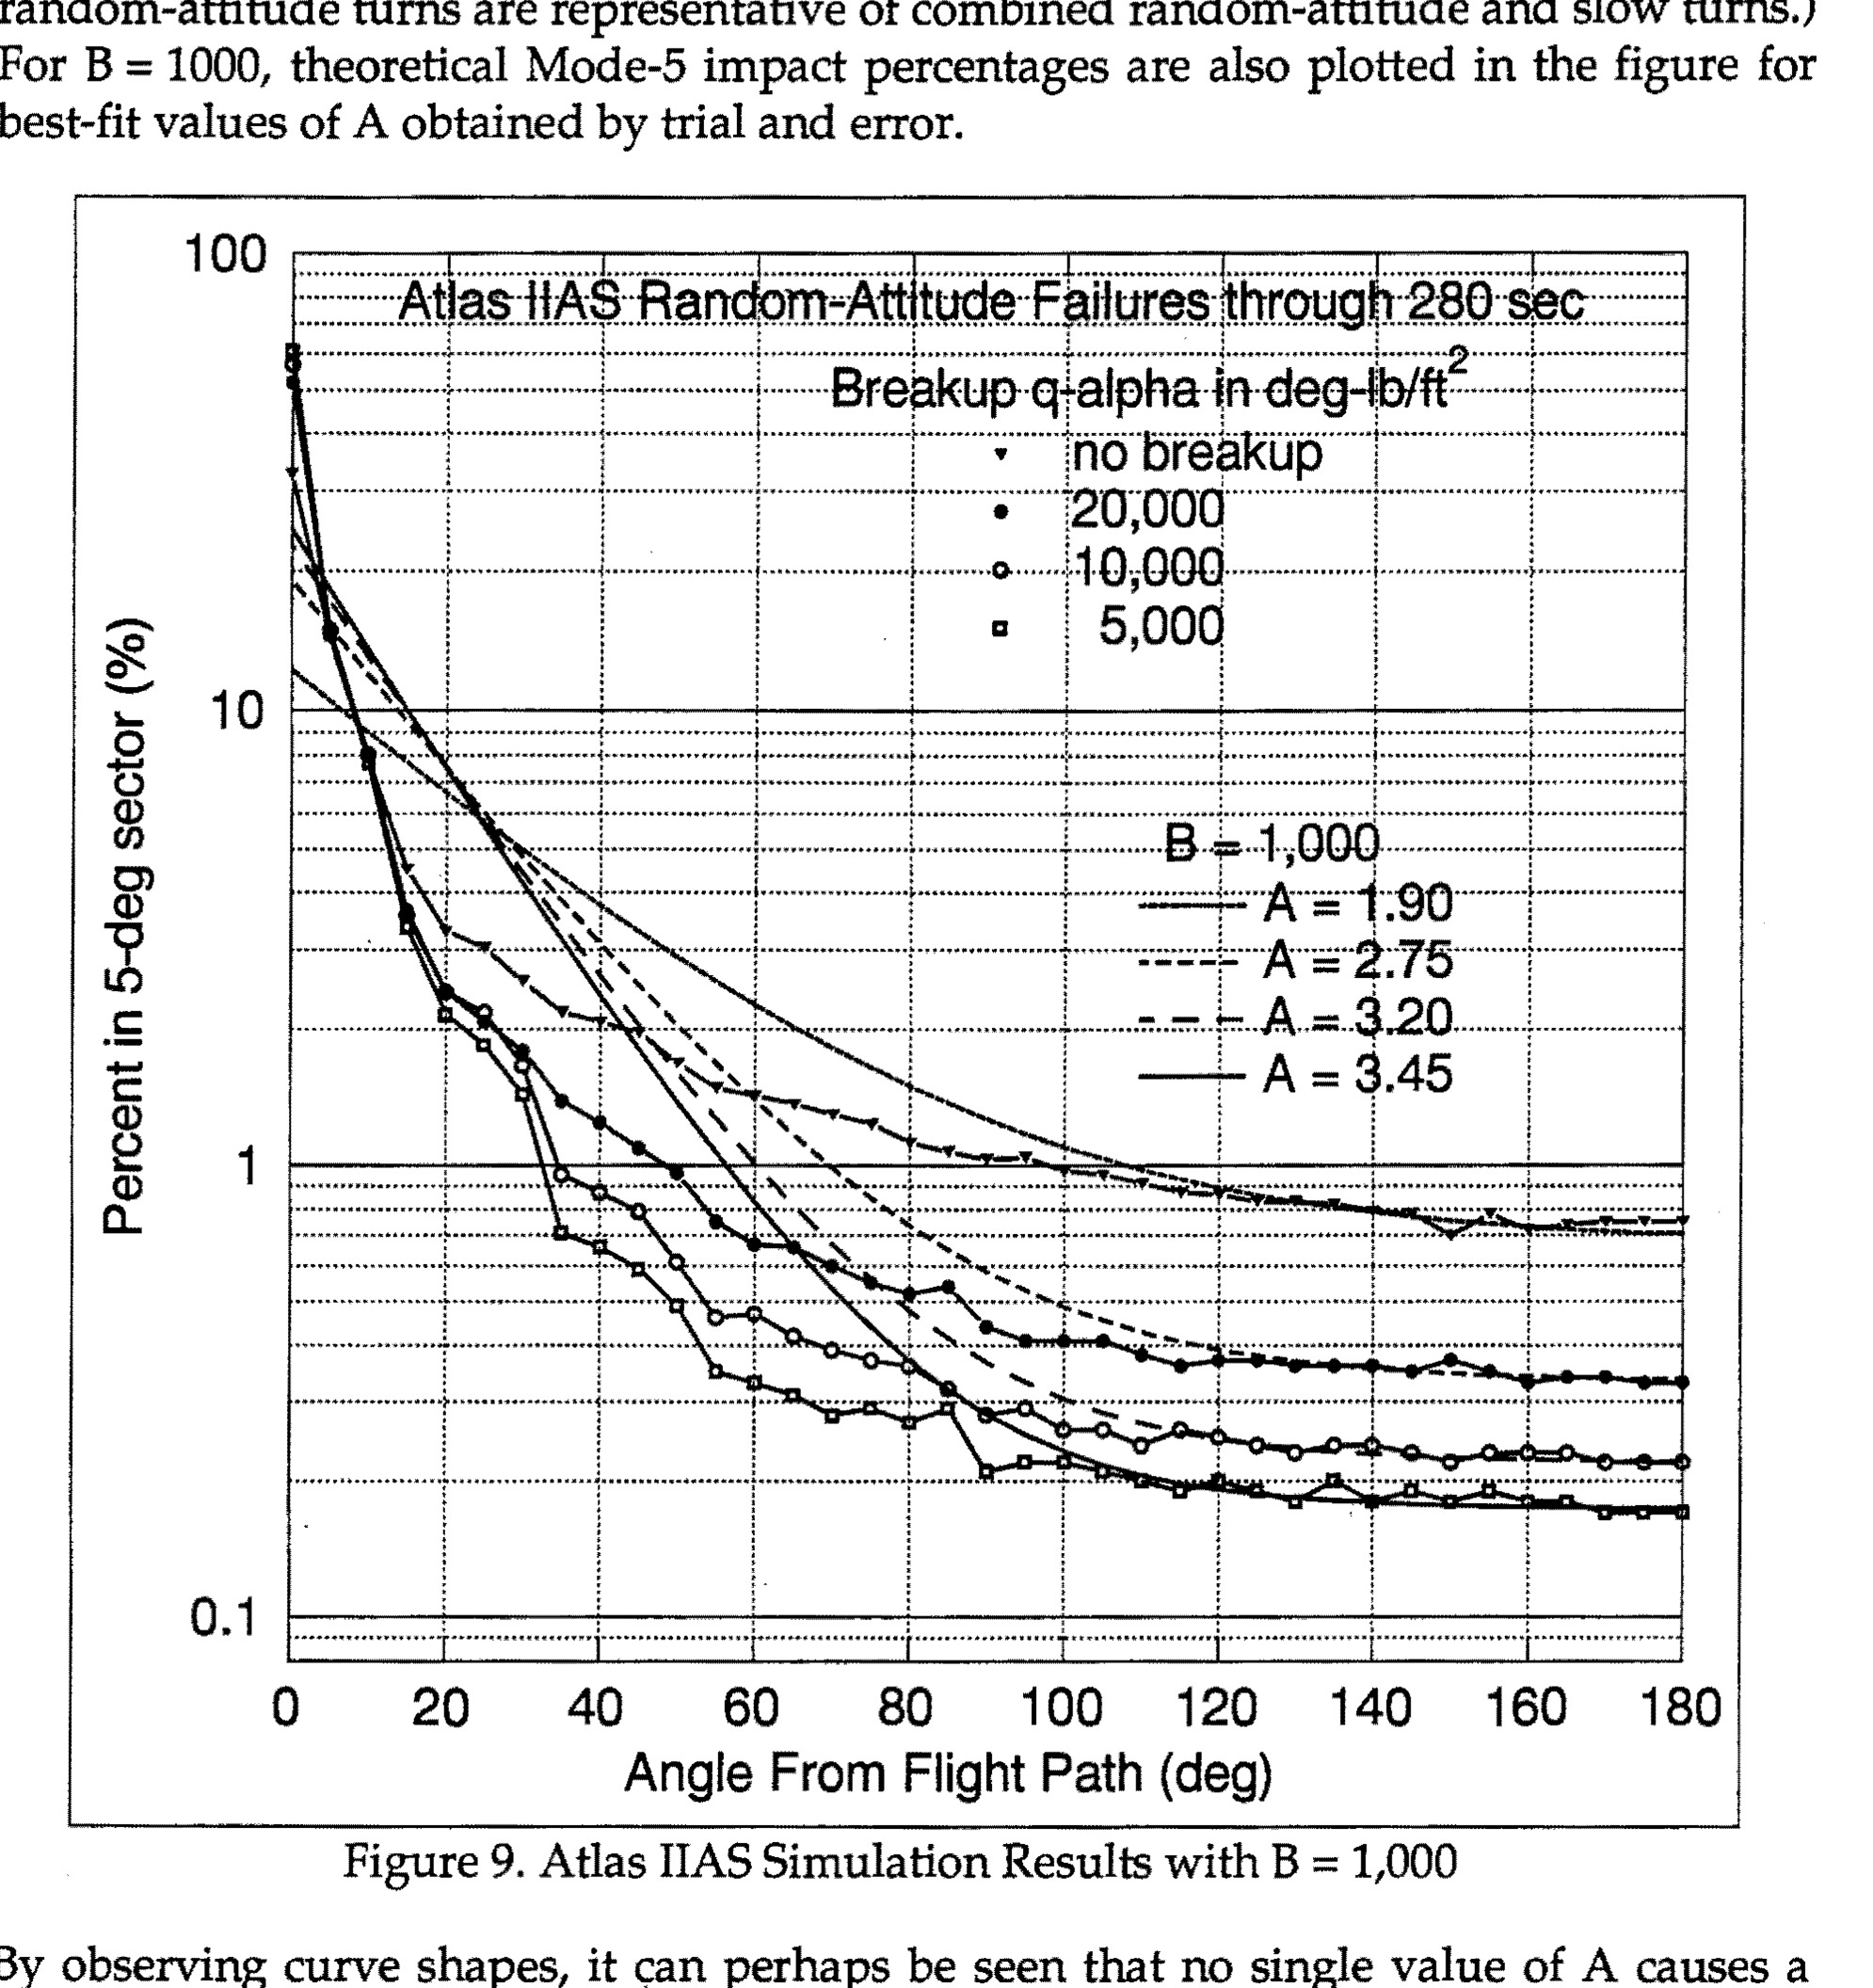
Figure 9. Atlas IIAS Simulation Results with B = 1,000
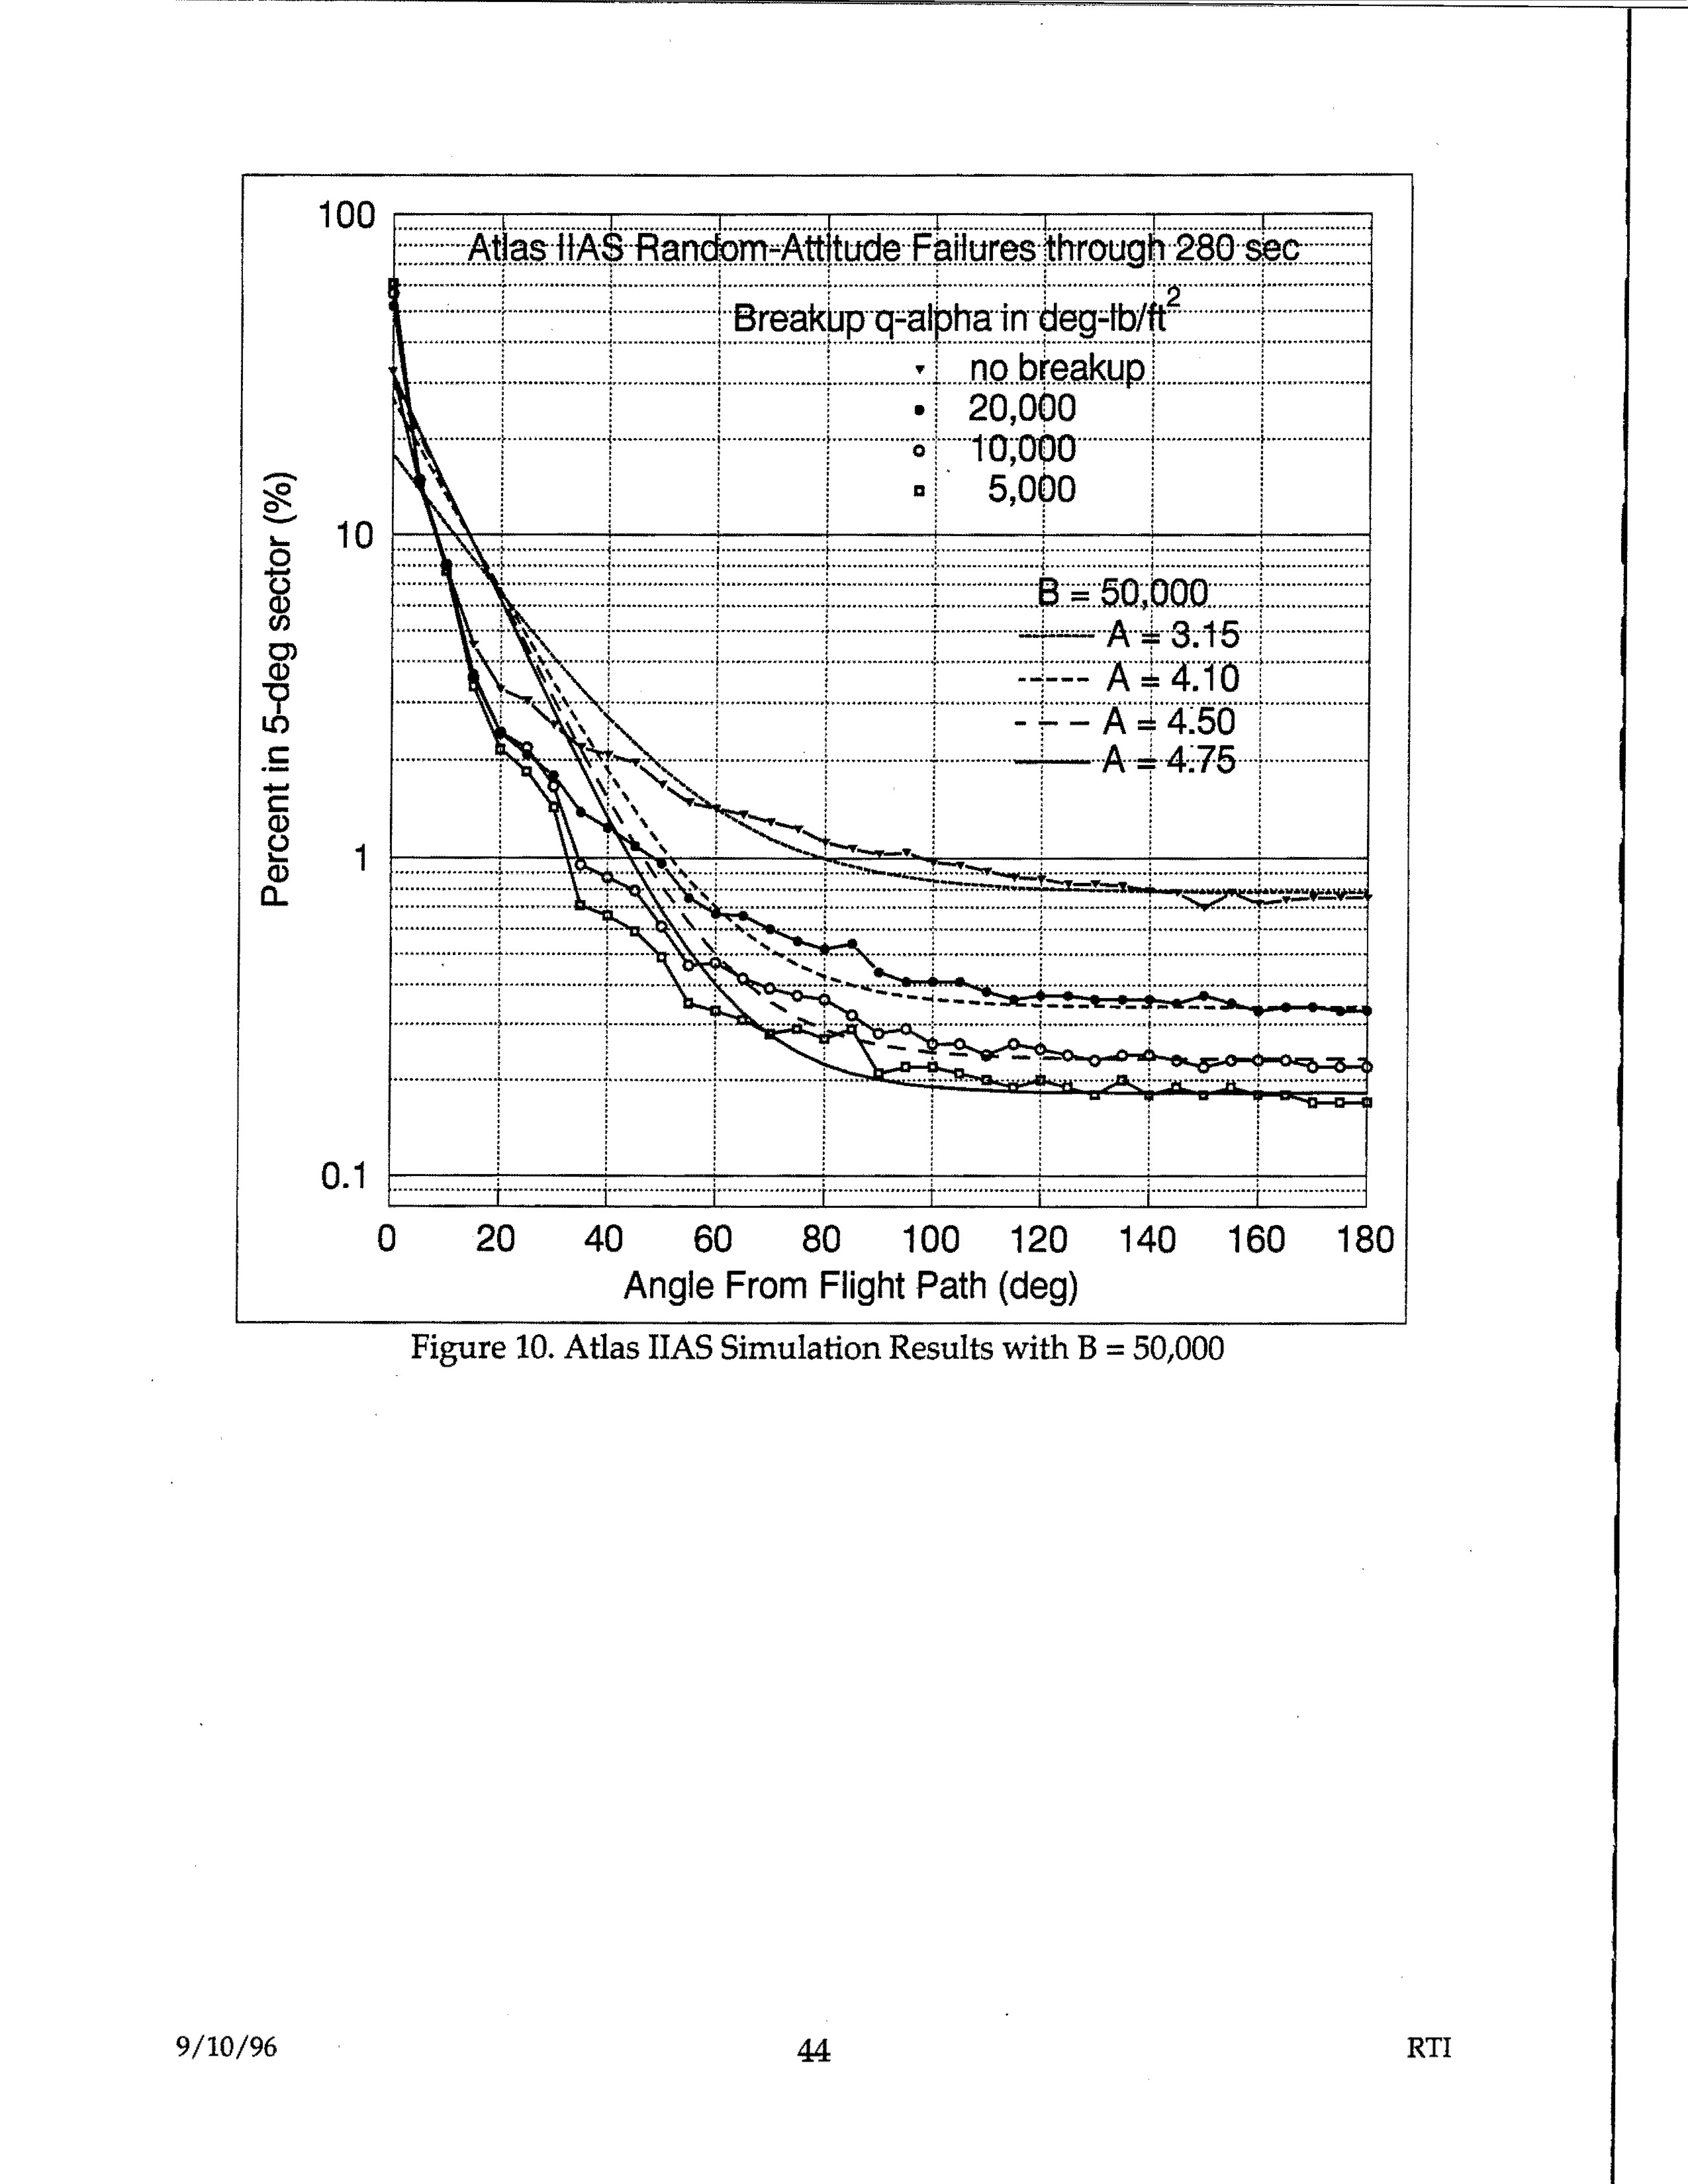
Figure 10. Atlas IIAS Simulation Results with B = 50,000 - Graph showing Percent in 5-deg sector (%) vs Angle From Flight Path (deg), with multiple curves for different Breakup q-alpha values in deg-lb/ft
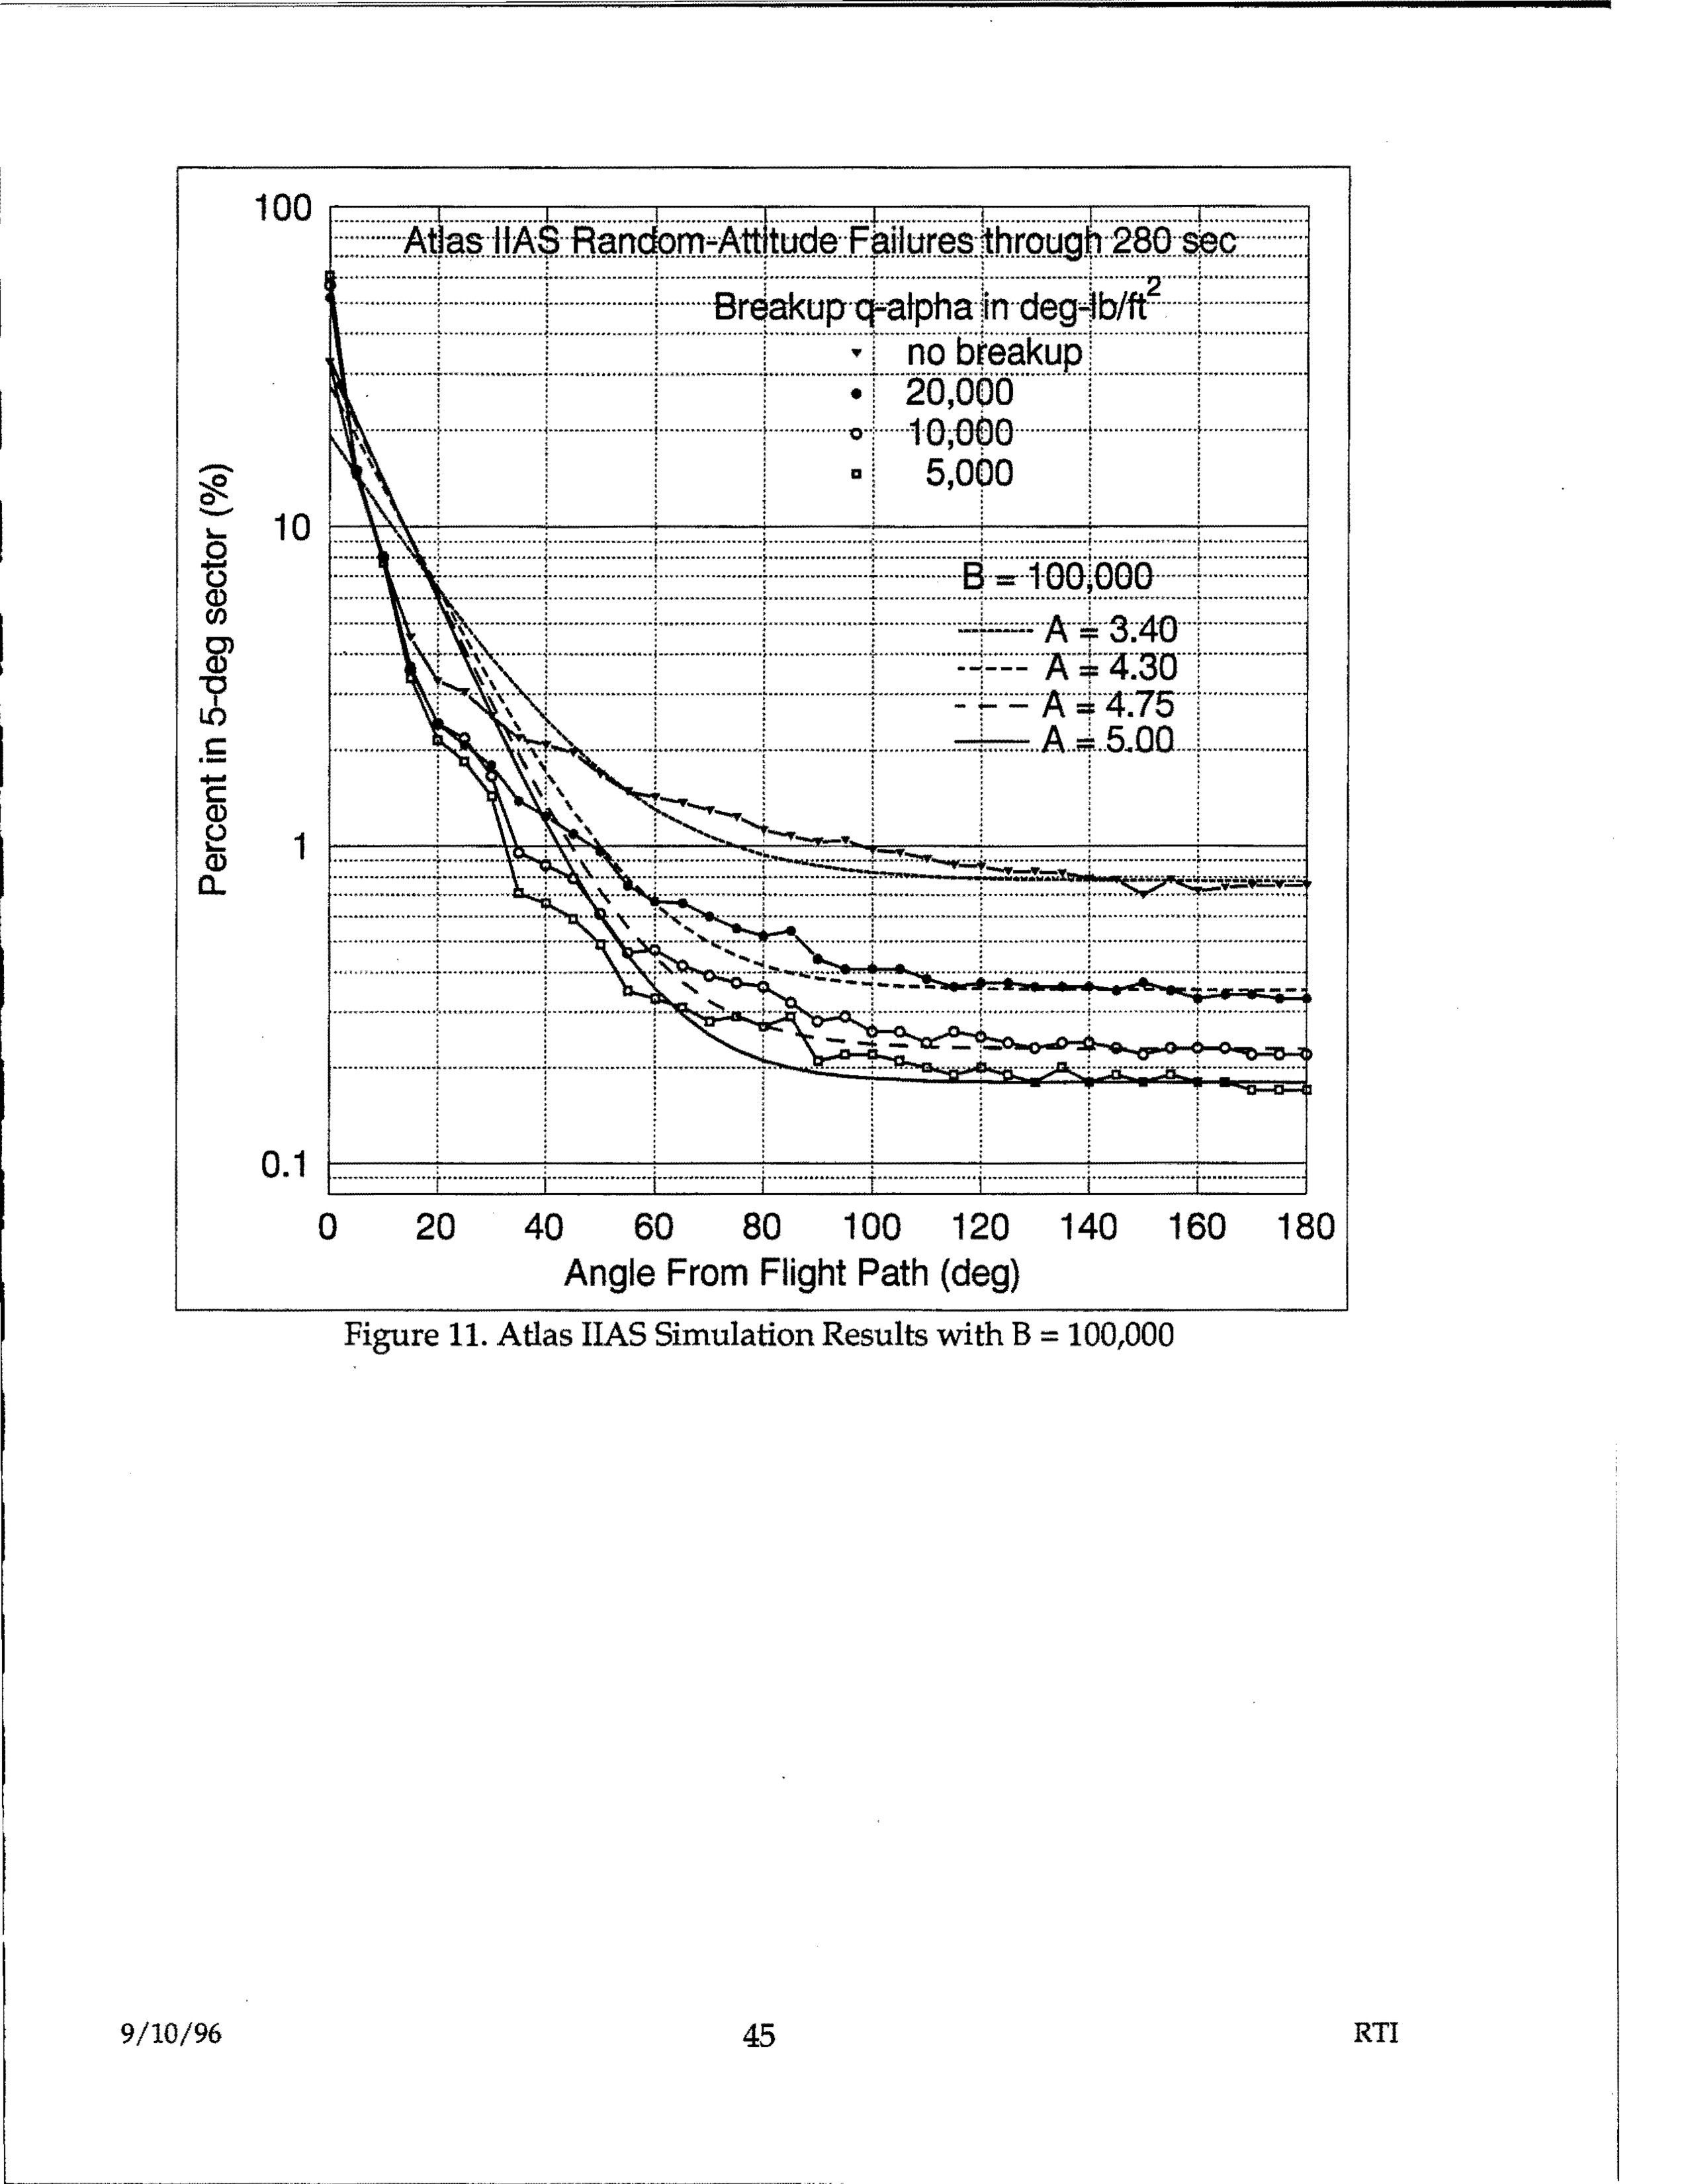
Figure 11. Atlas IIAS Simulation Results with B = 100,000 - Graph showing Atlas IIAS Random-Attitude Failures through 280 sec, plotting Percent in 5-deg sector vs Angle From Flight Path (deg), with multiple curves for different Breakup q-alpha values in deg-lb/ft² (no breakup, 20,000, 10,000, 5,000) and B = 100,000 with A values of 3.40, 4.30, 4.75, and 5.00
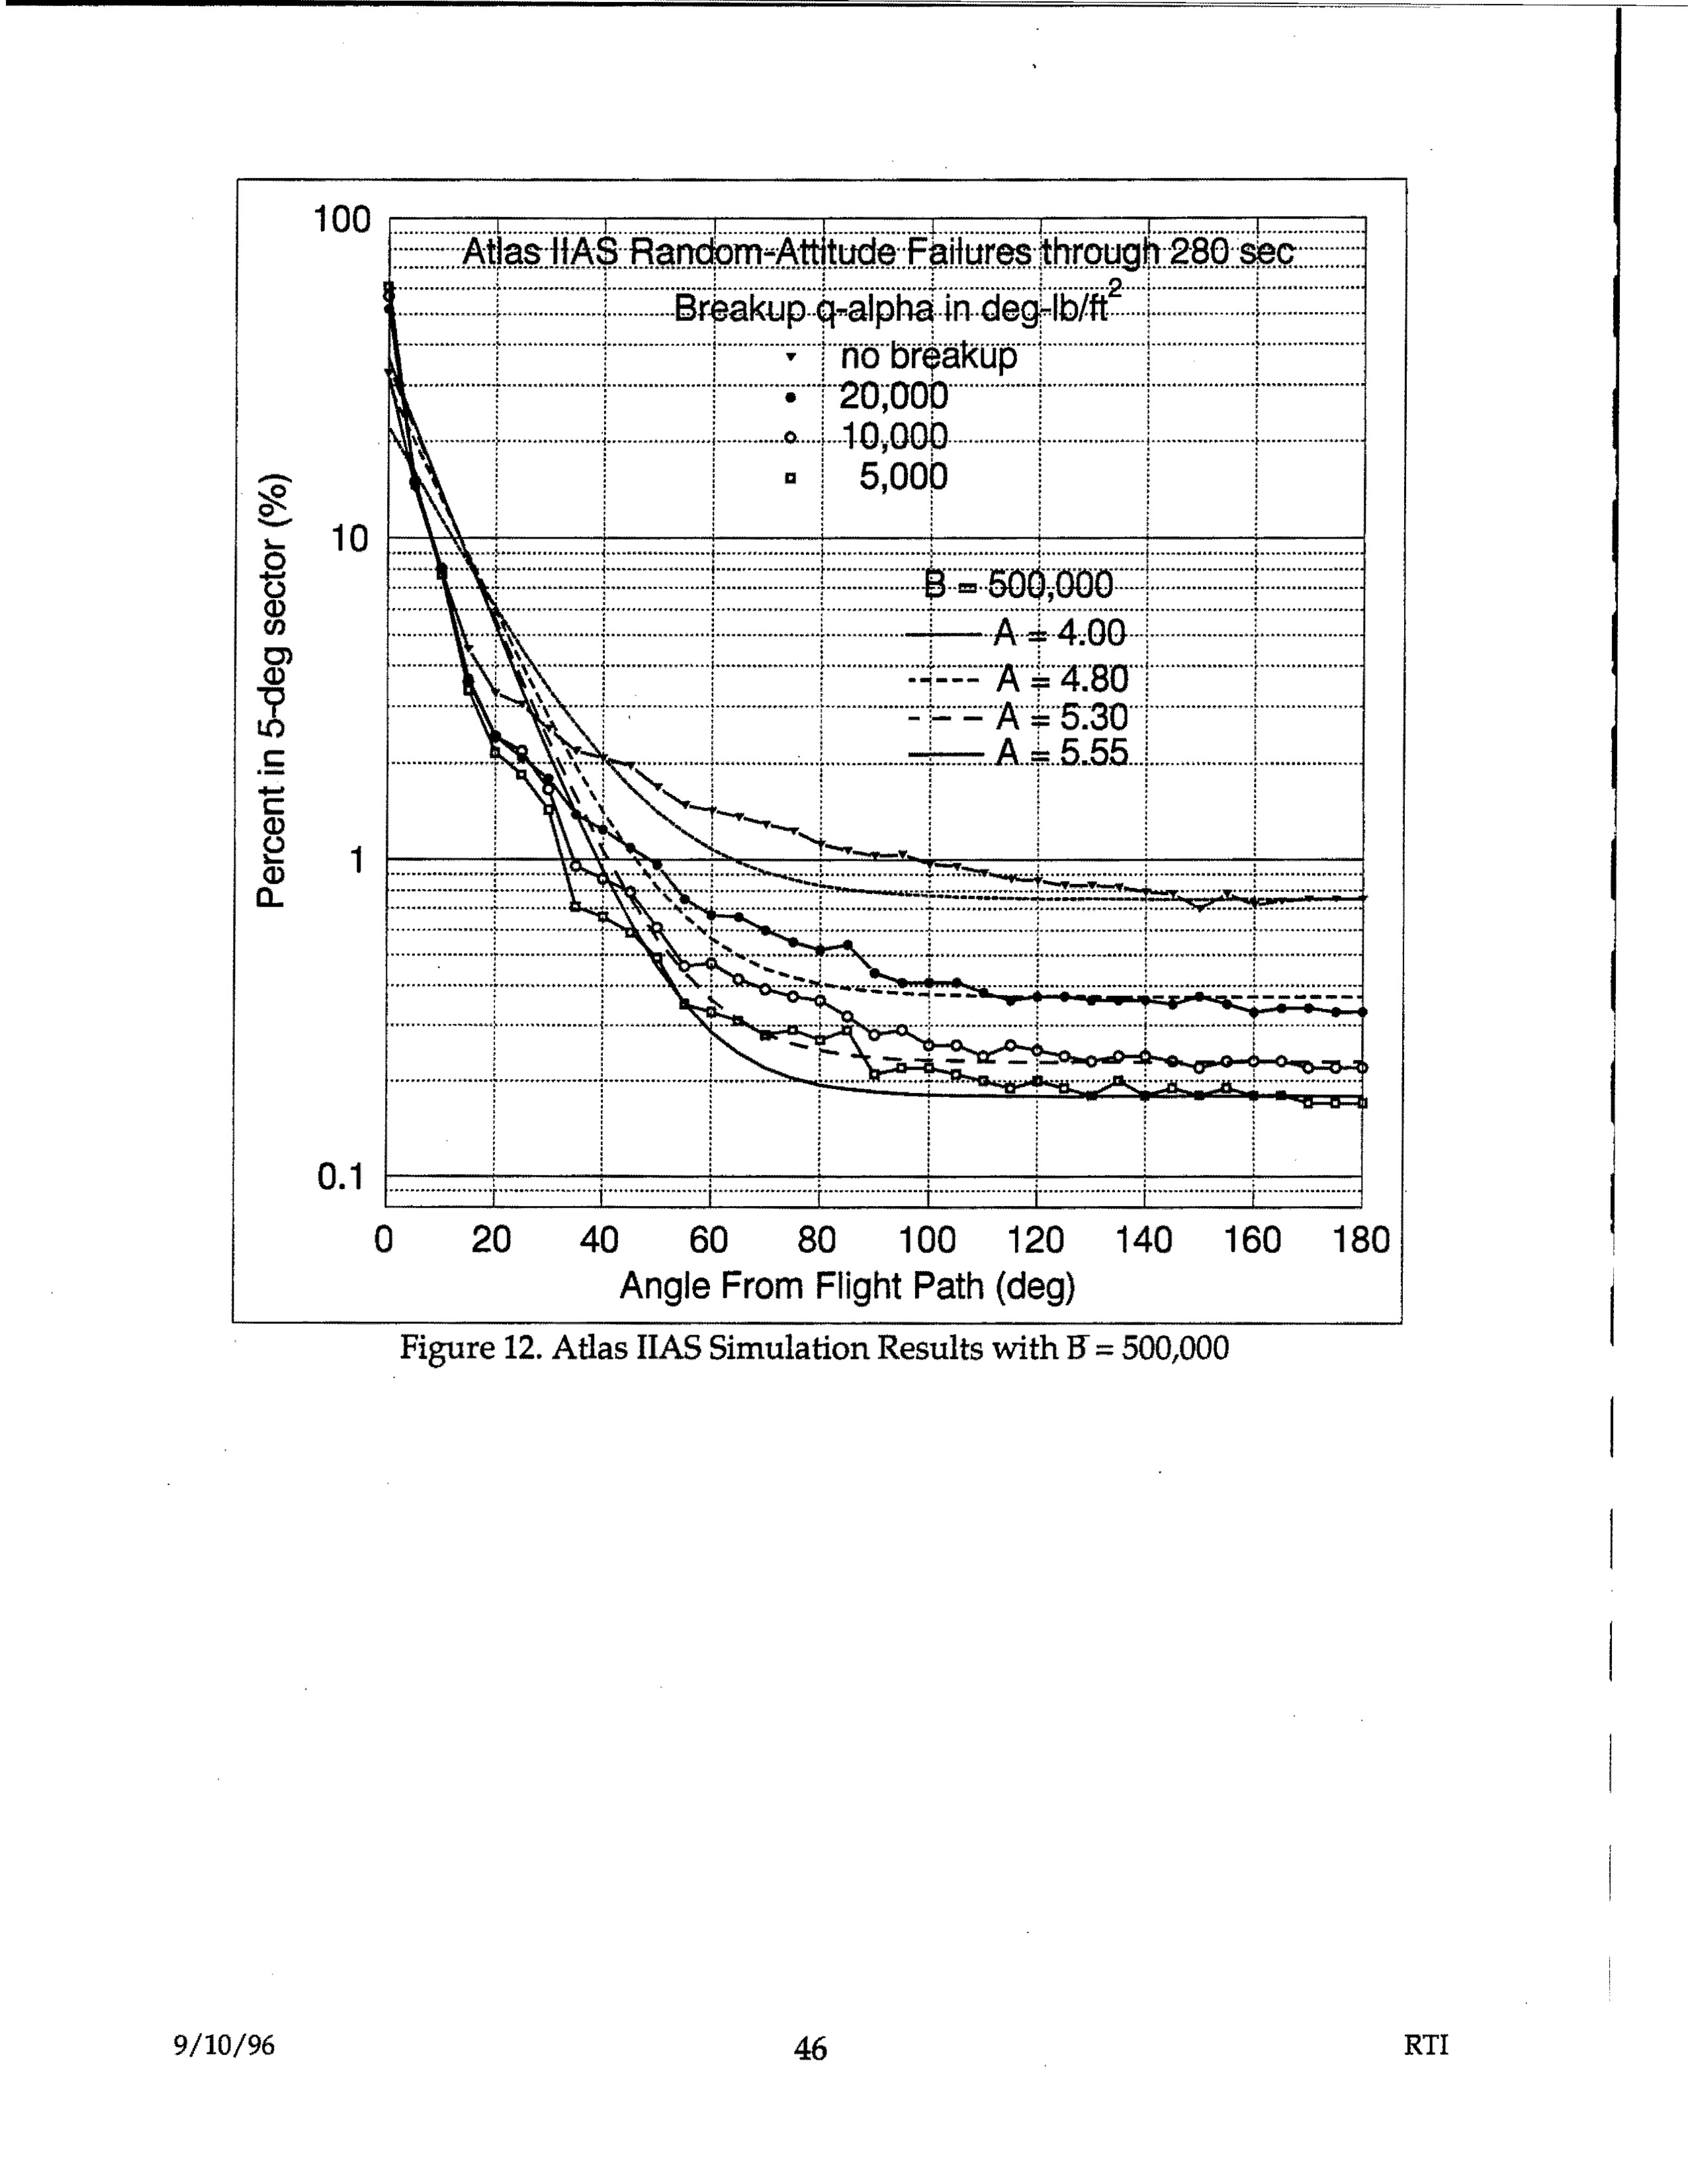
Atlas IIAS Random-Attitude Failures through 280 sec - Breakup q-alpha in deg-lb/ft - showing percent in 5-deg sector vs angle from flight path with various breakup values (no breakup, 20,000, 10,000, 5,000) and B=500,000 with A values 4.00, 4.80, 5.30, 5.55
Atlas IIAS Random-Attitude Failures through 280 sec, Breakup q-alpha in deg-lb/ft^2, showing percent in 5-deg sector vs angle from flight path
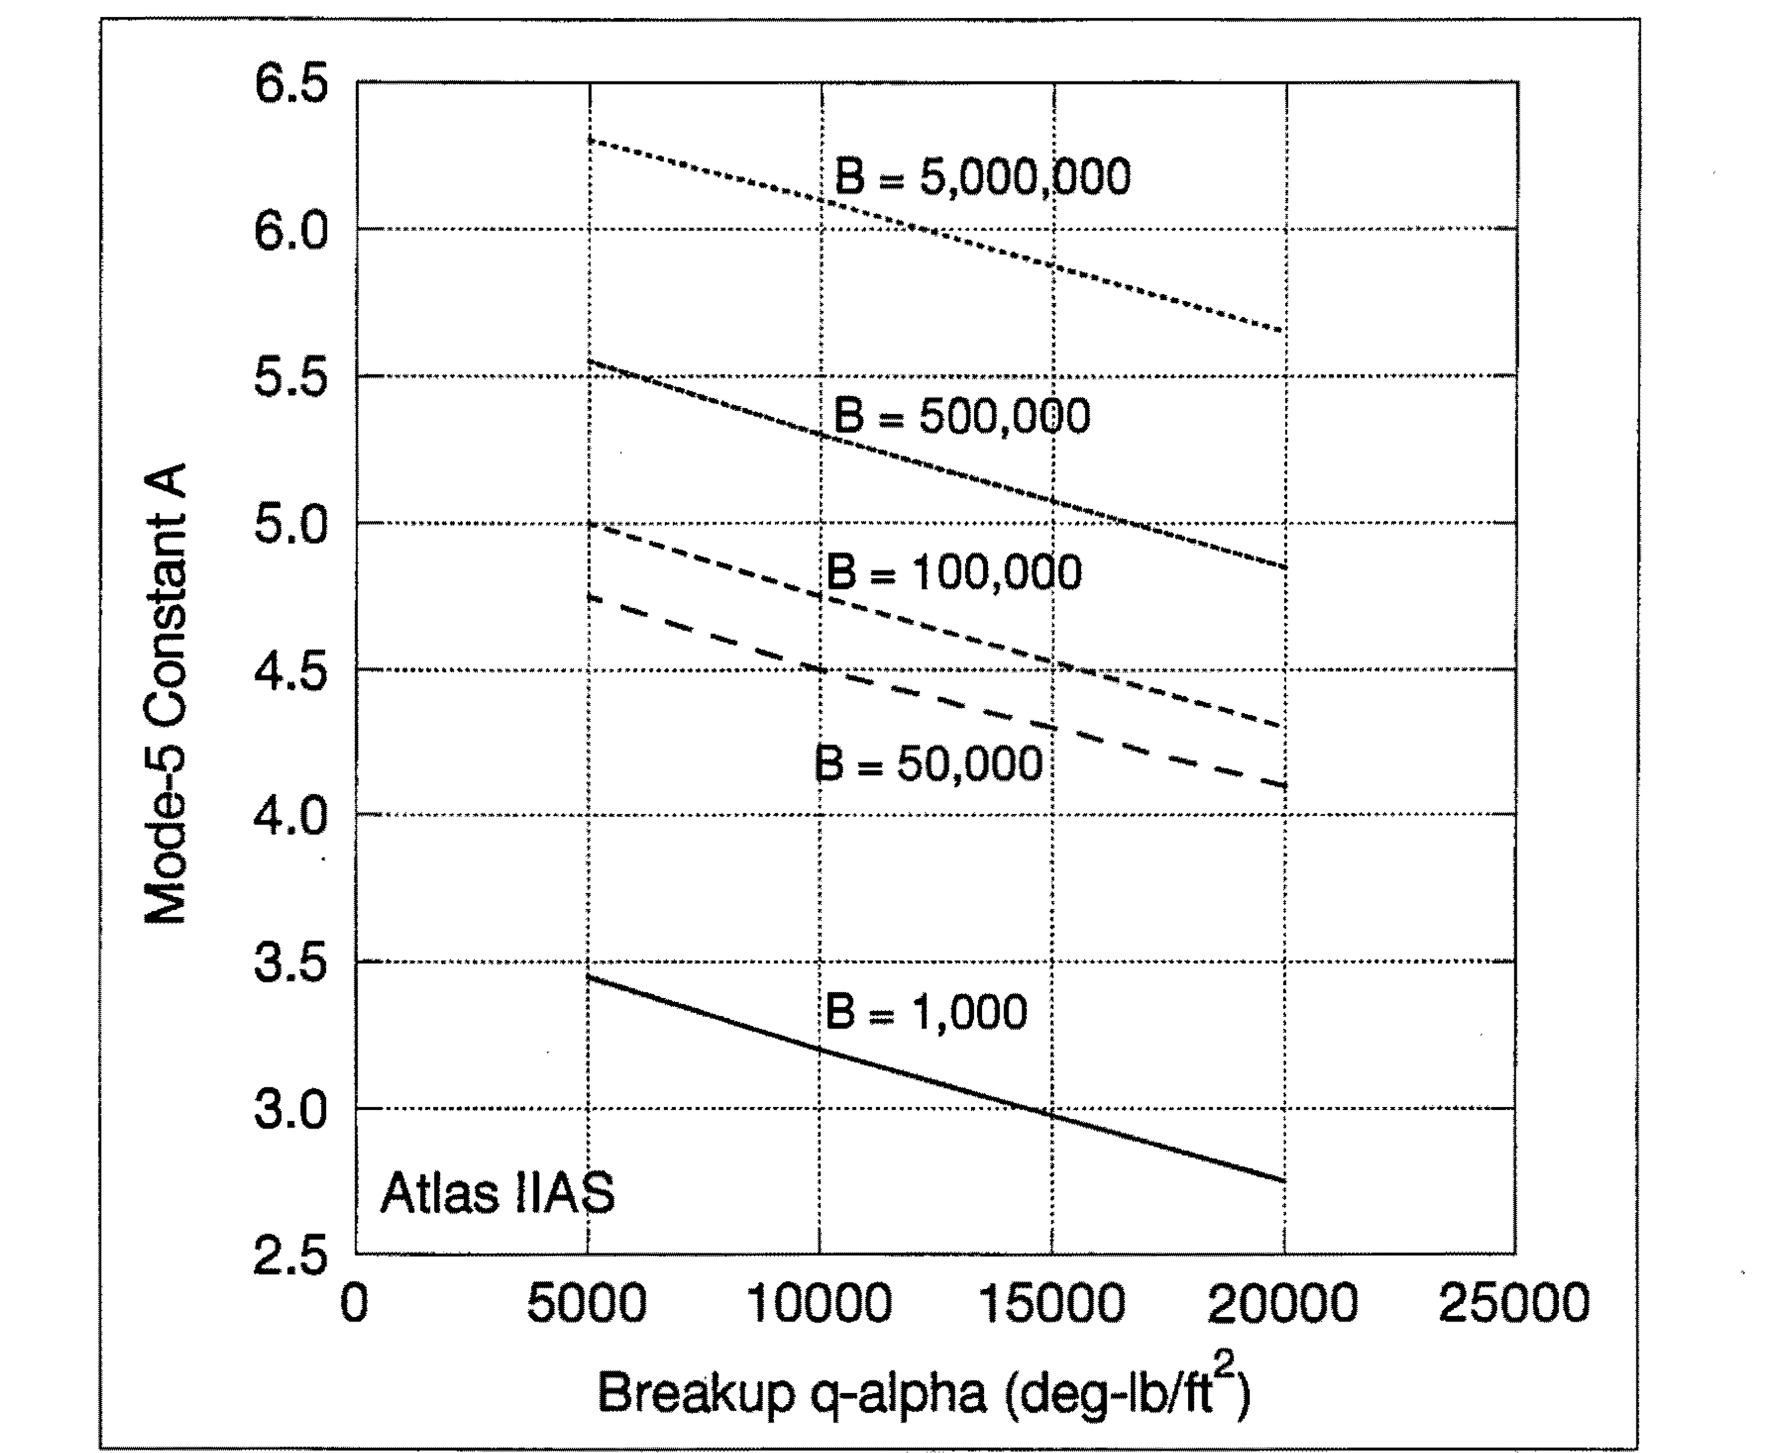
Figure 14. Effects of Breakup q-alpha on A for Atlas IIAS
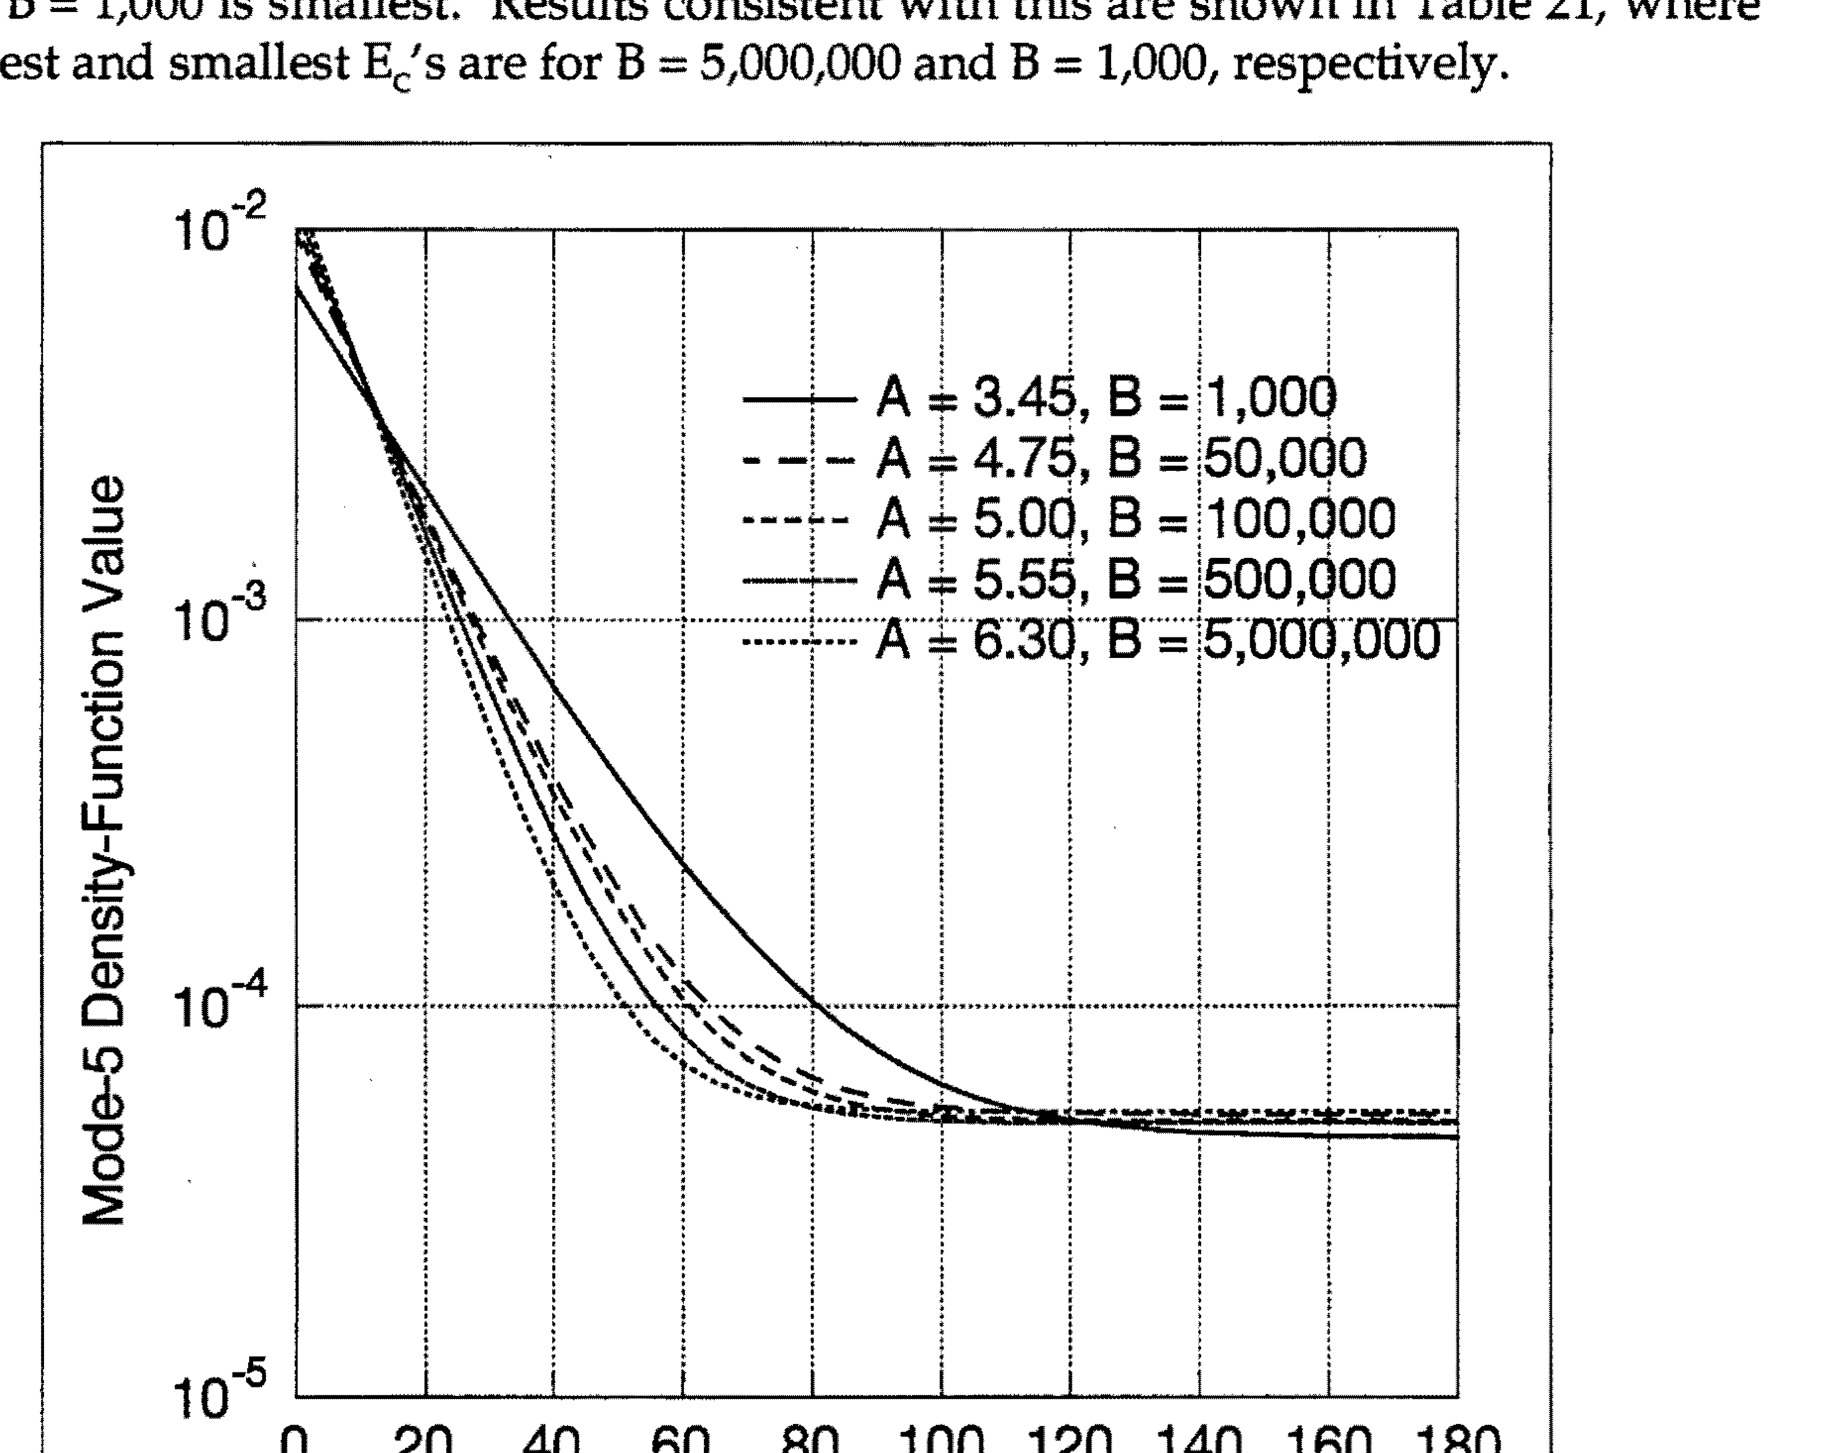
Figure 15. Mode-5 Density-Function Values at Three Miles
Atlas IIAS Mode-5 Ship-Hit Contours with A = 3.00, showing crossrange distance vs downrange distance with contour lines for 10^-5 and 10^-6, B = 1,000 and A = 3.00
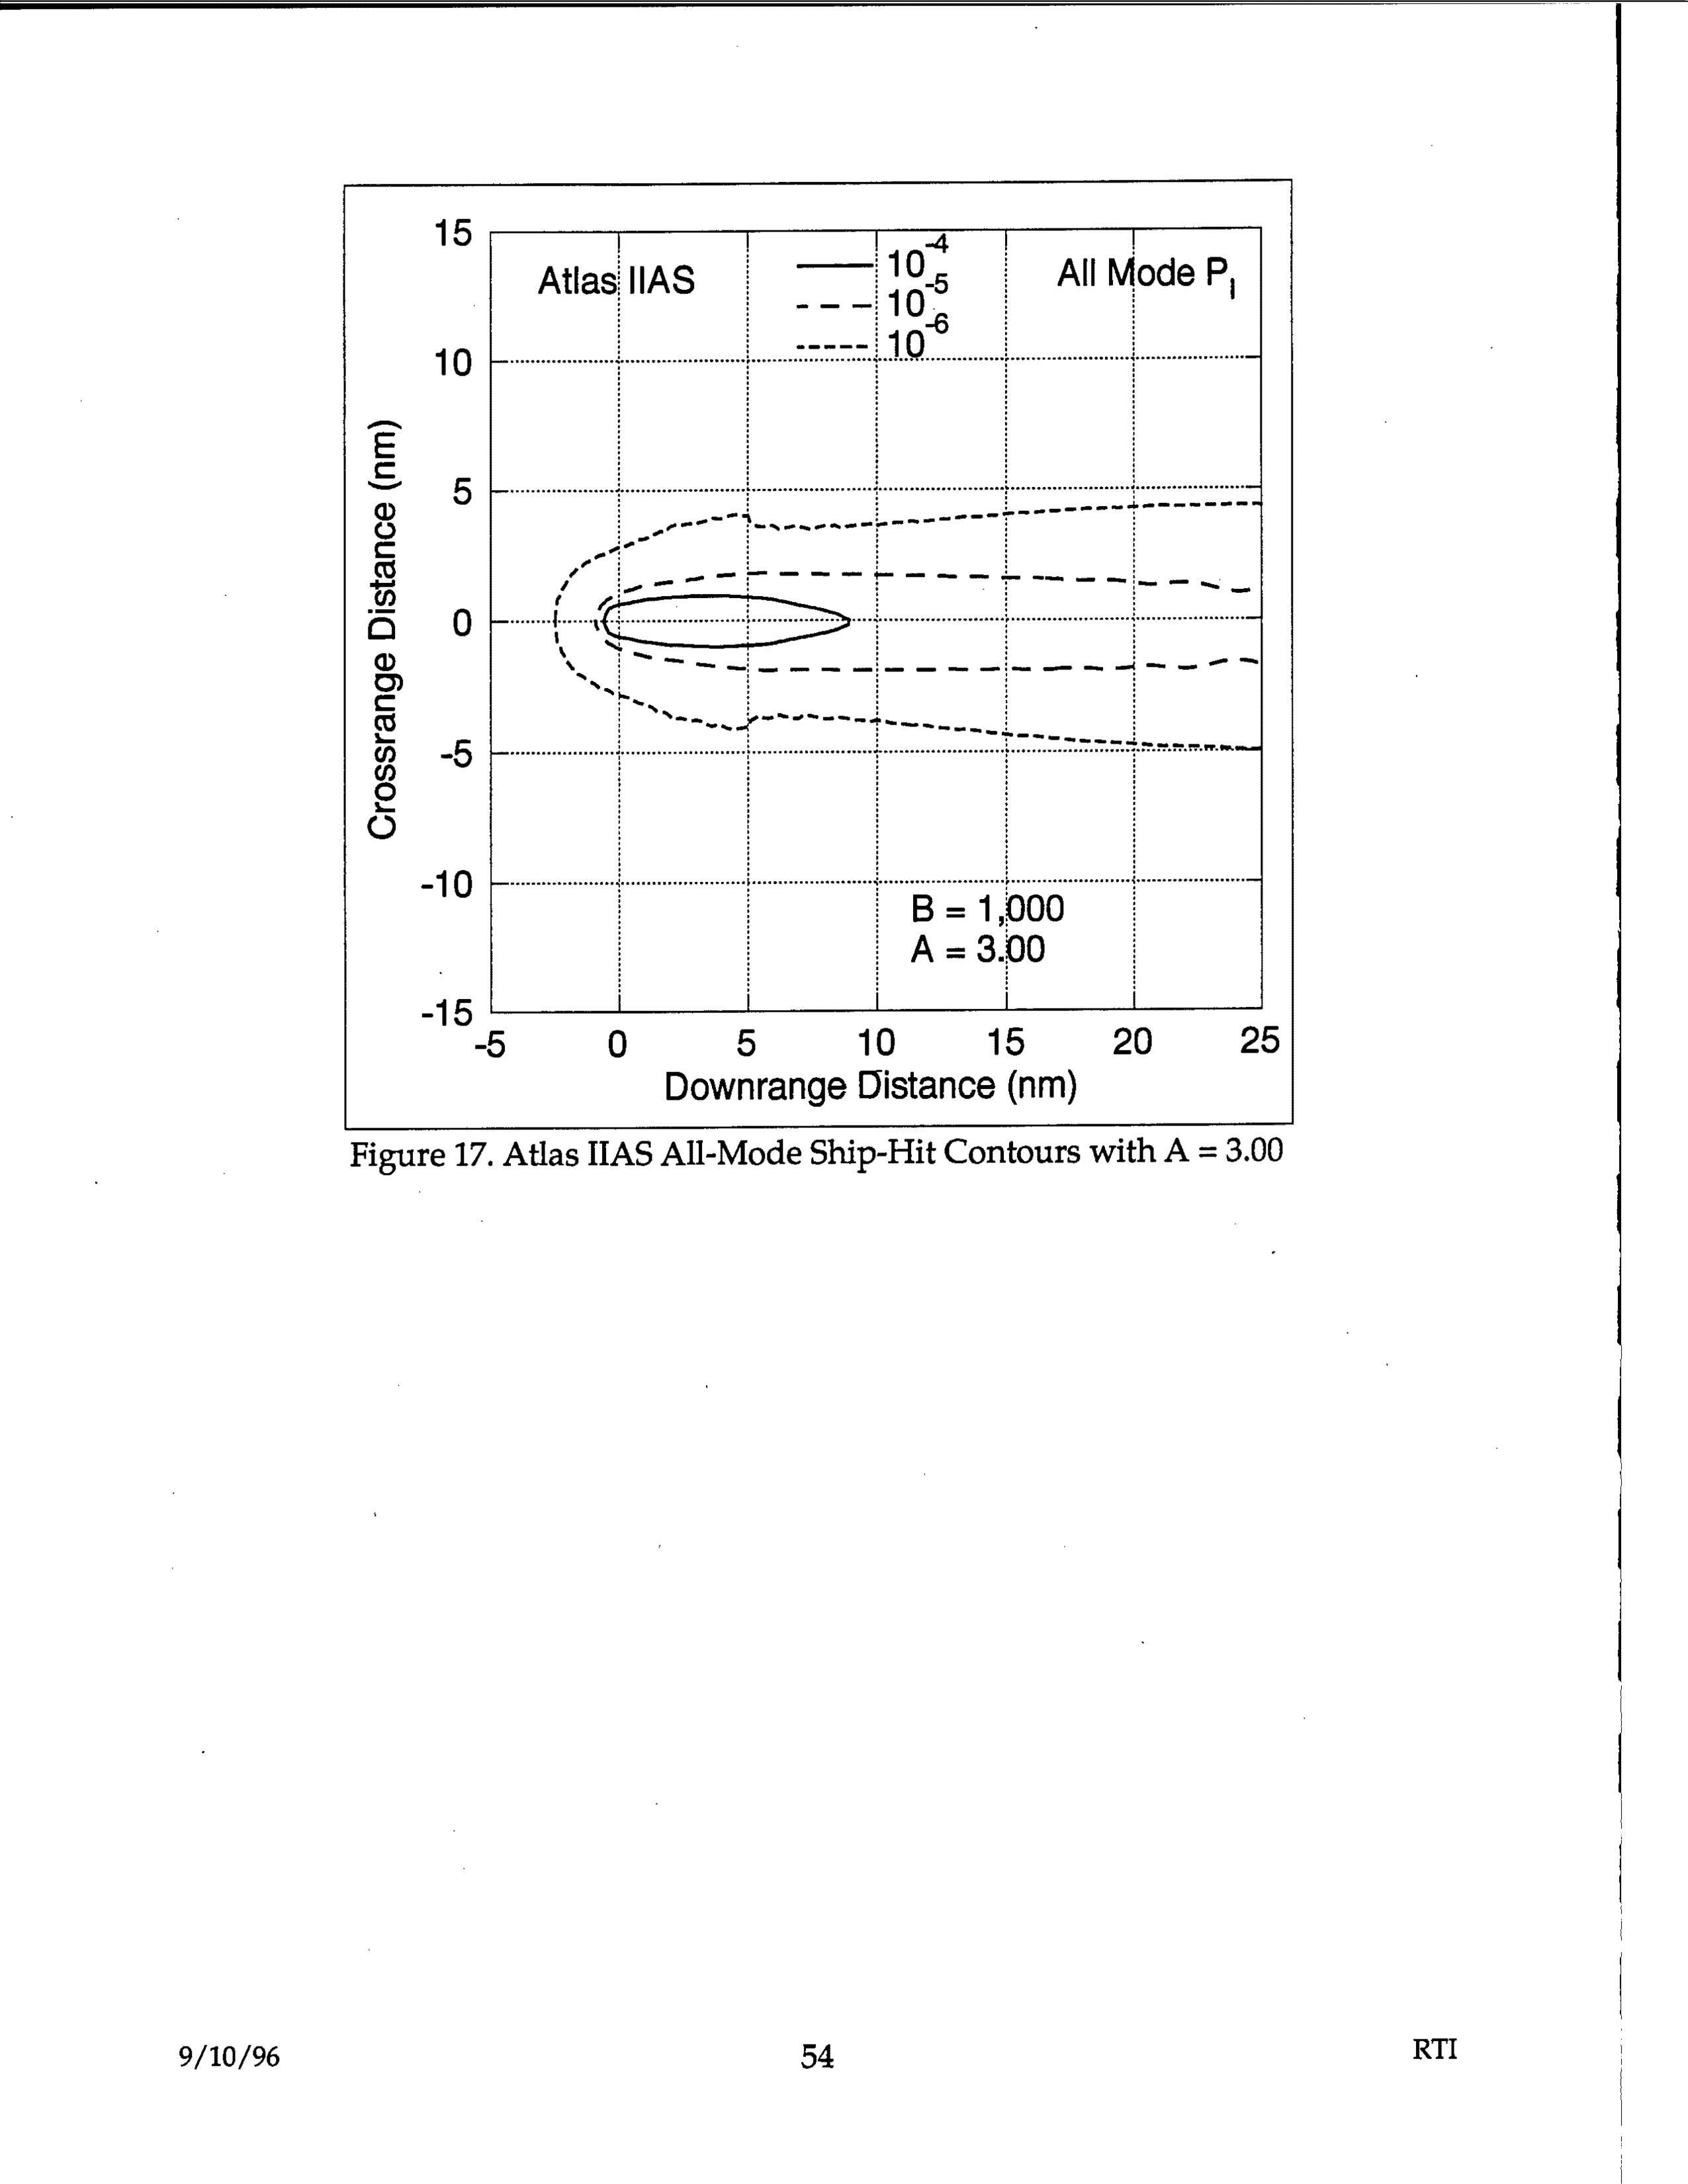
Atlas IIAS All-Mode Ship-Hit Contours showing crossrange distance (nm) vs downrange distance (nm) with probability contours 10^-4, 10^-5, 10^-6, B = 1,000, A = 3.00
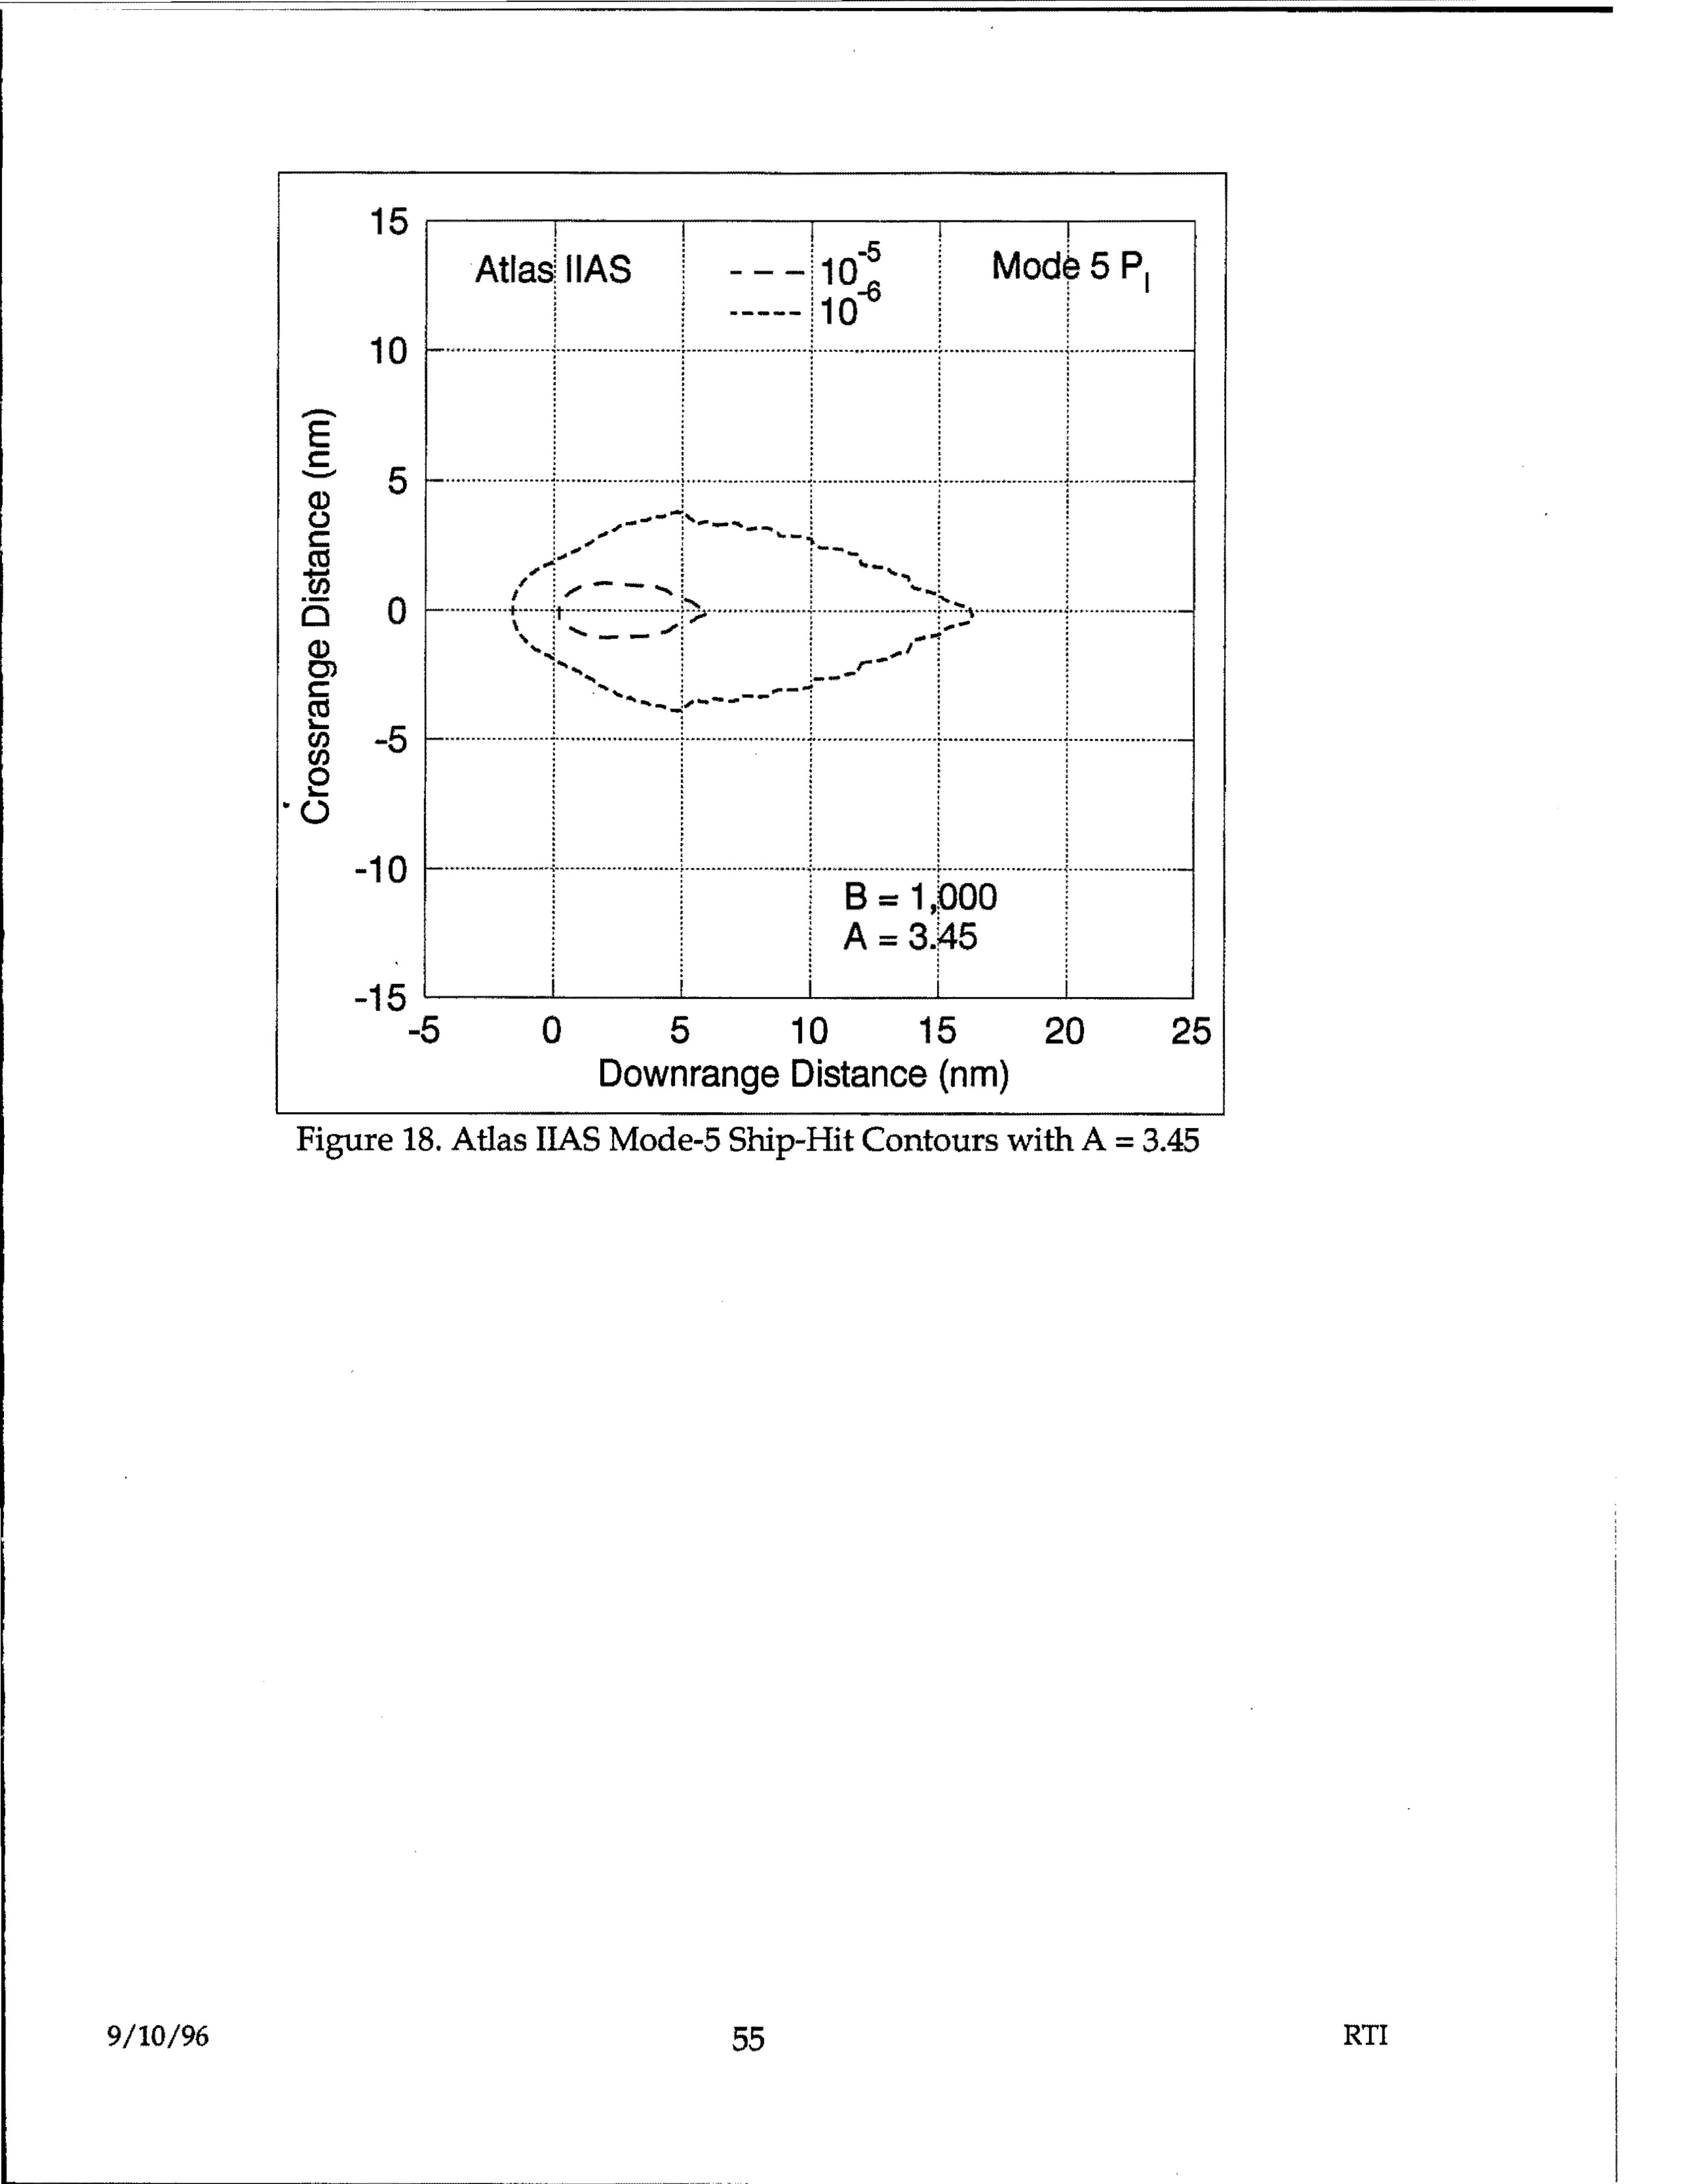
Atlas IIAS Mode-5 Ship-Hit Contours showing crossrange vs downrange distance with probability contours 10^-5 and 10^-8, Mode 5 P_I, B=1,000, A=3.45
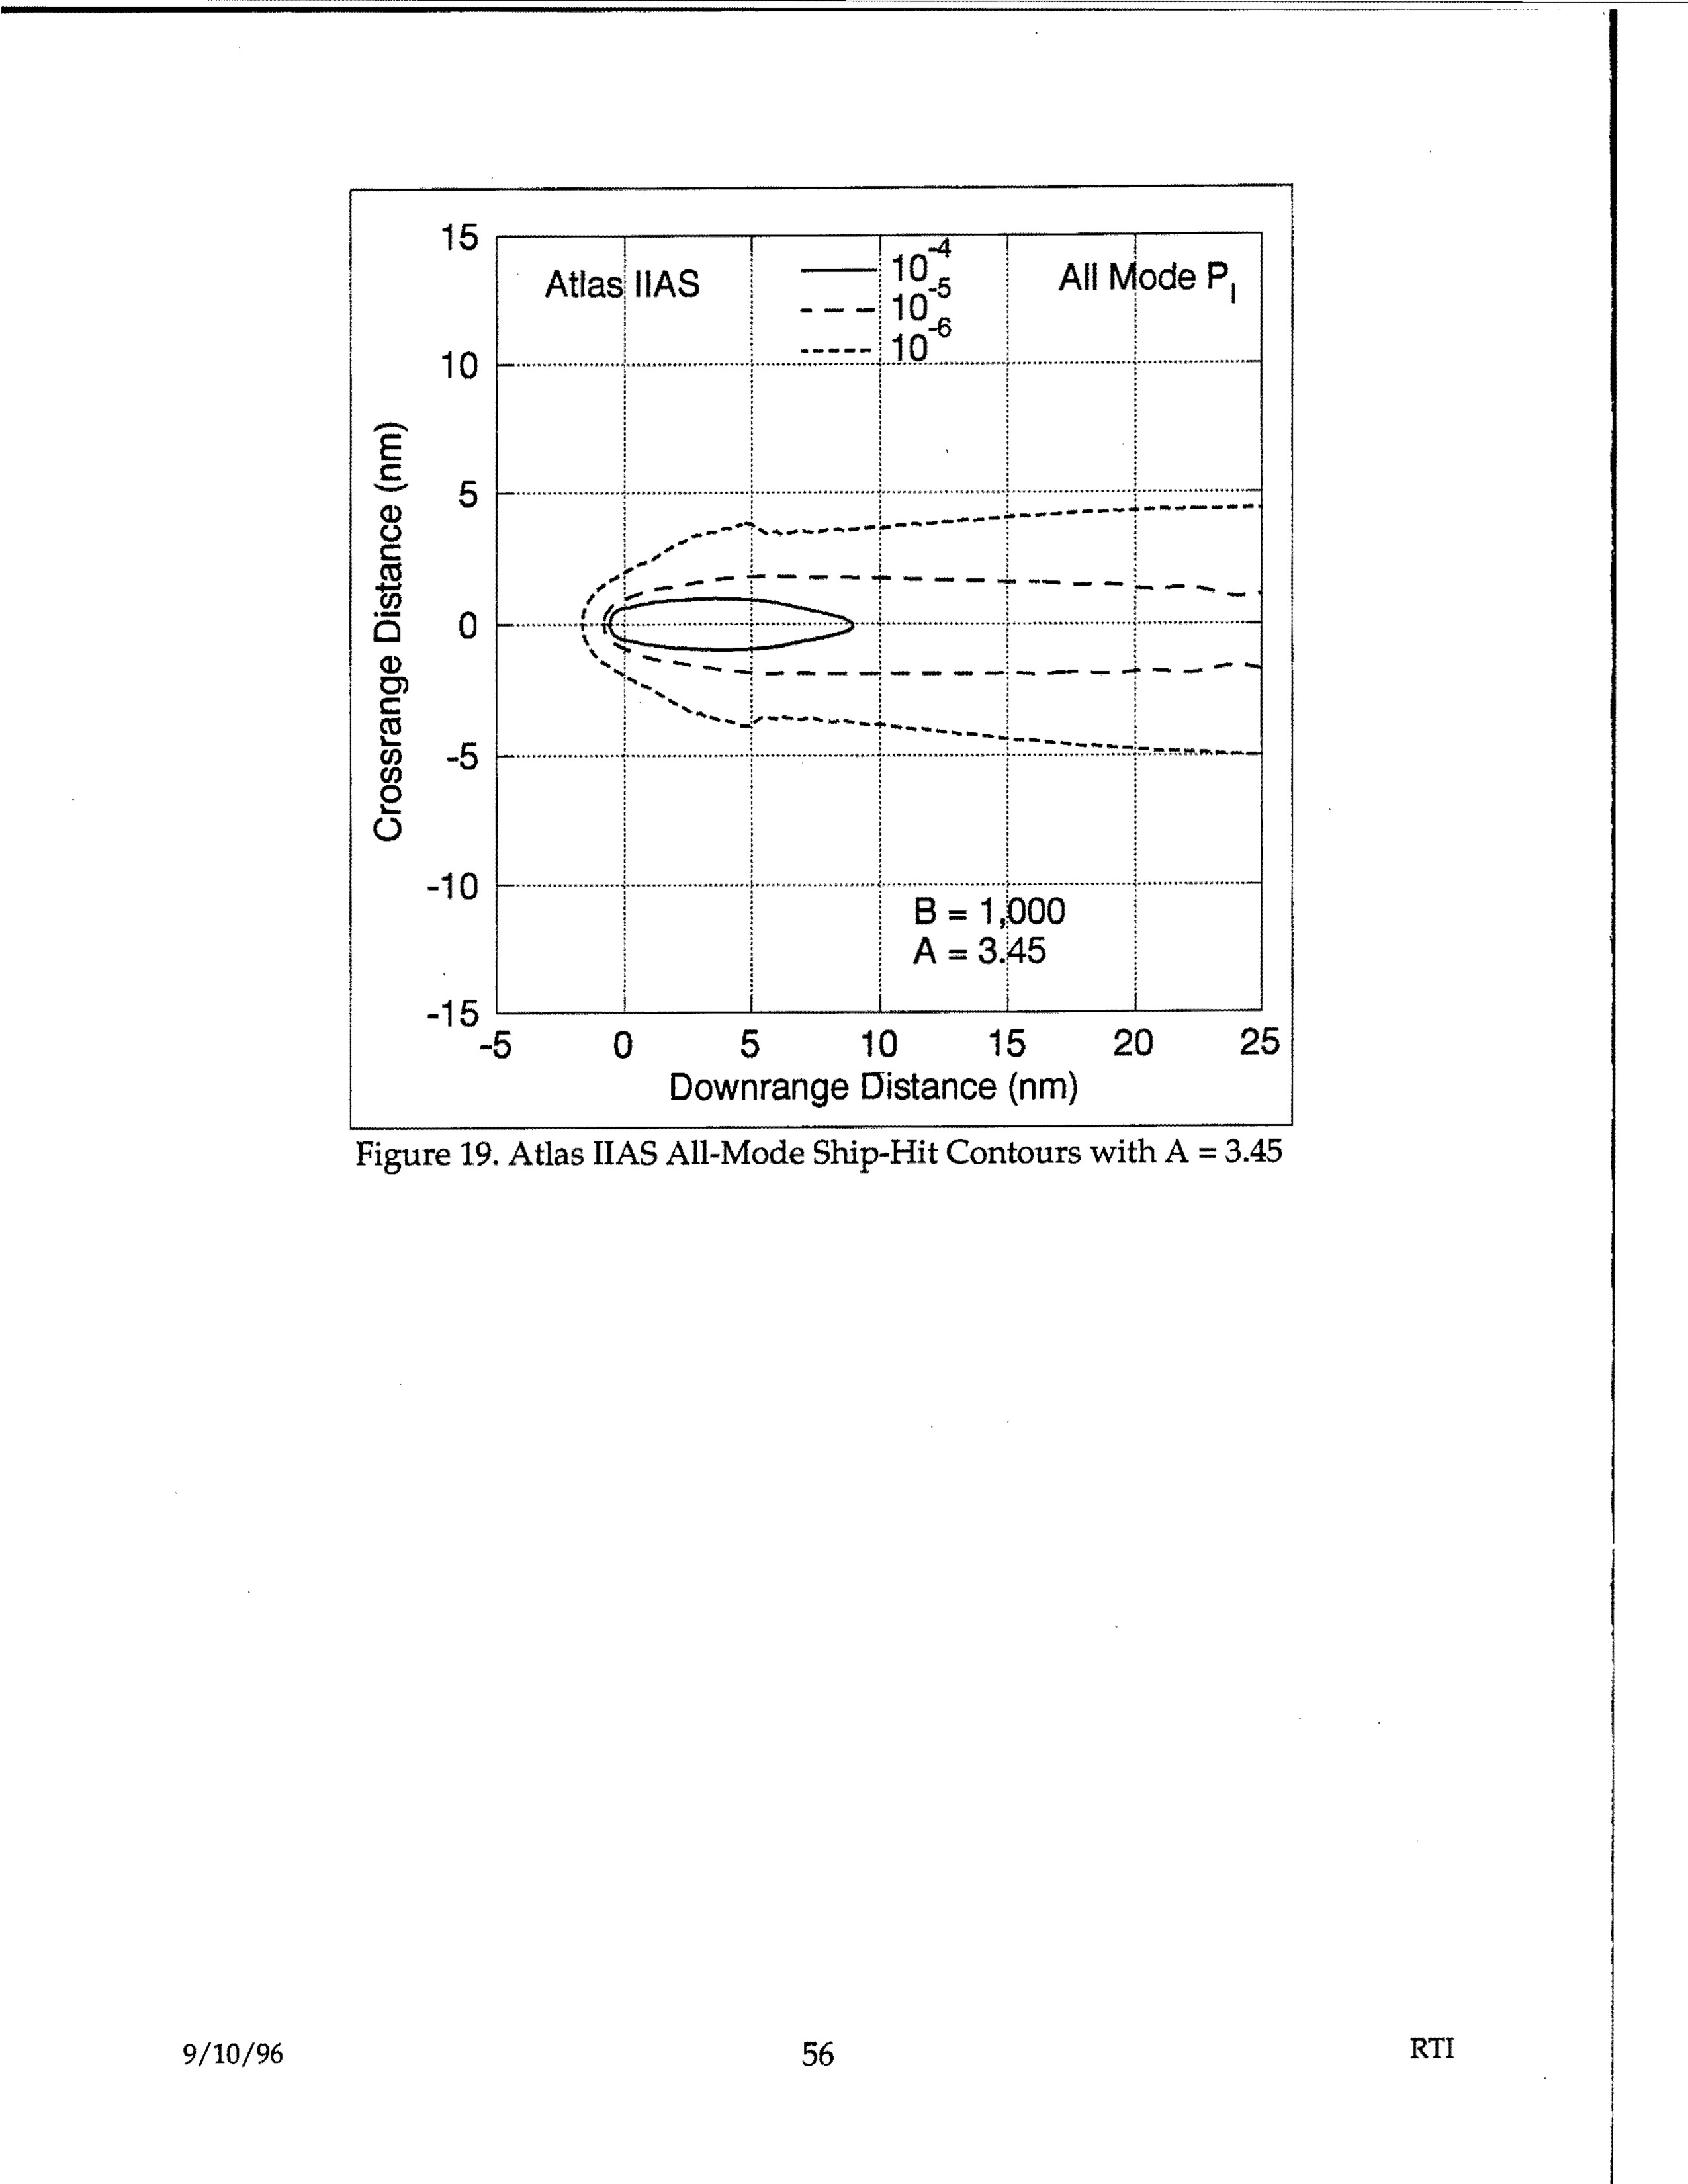
Atlas IIAS All-Mode Ship-Hit Contours with A = 3.45, showing crossrange distance (nm) vs downrange distance (nm) with probability contours 10^-4, 10^-5, 10^-6 and parameters B = 1,000, A = 3.45
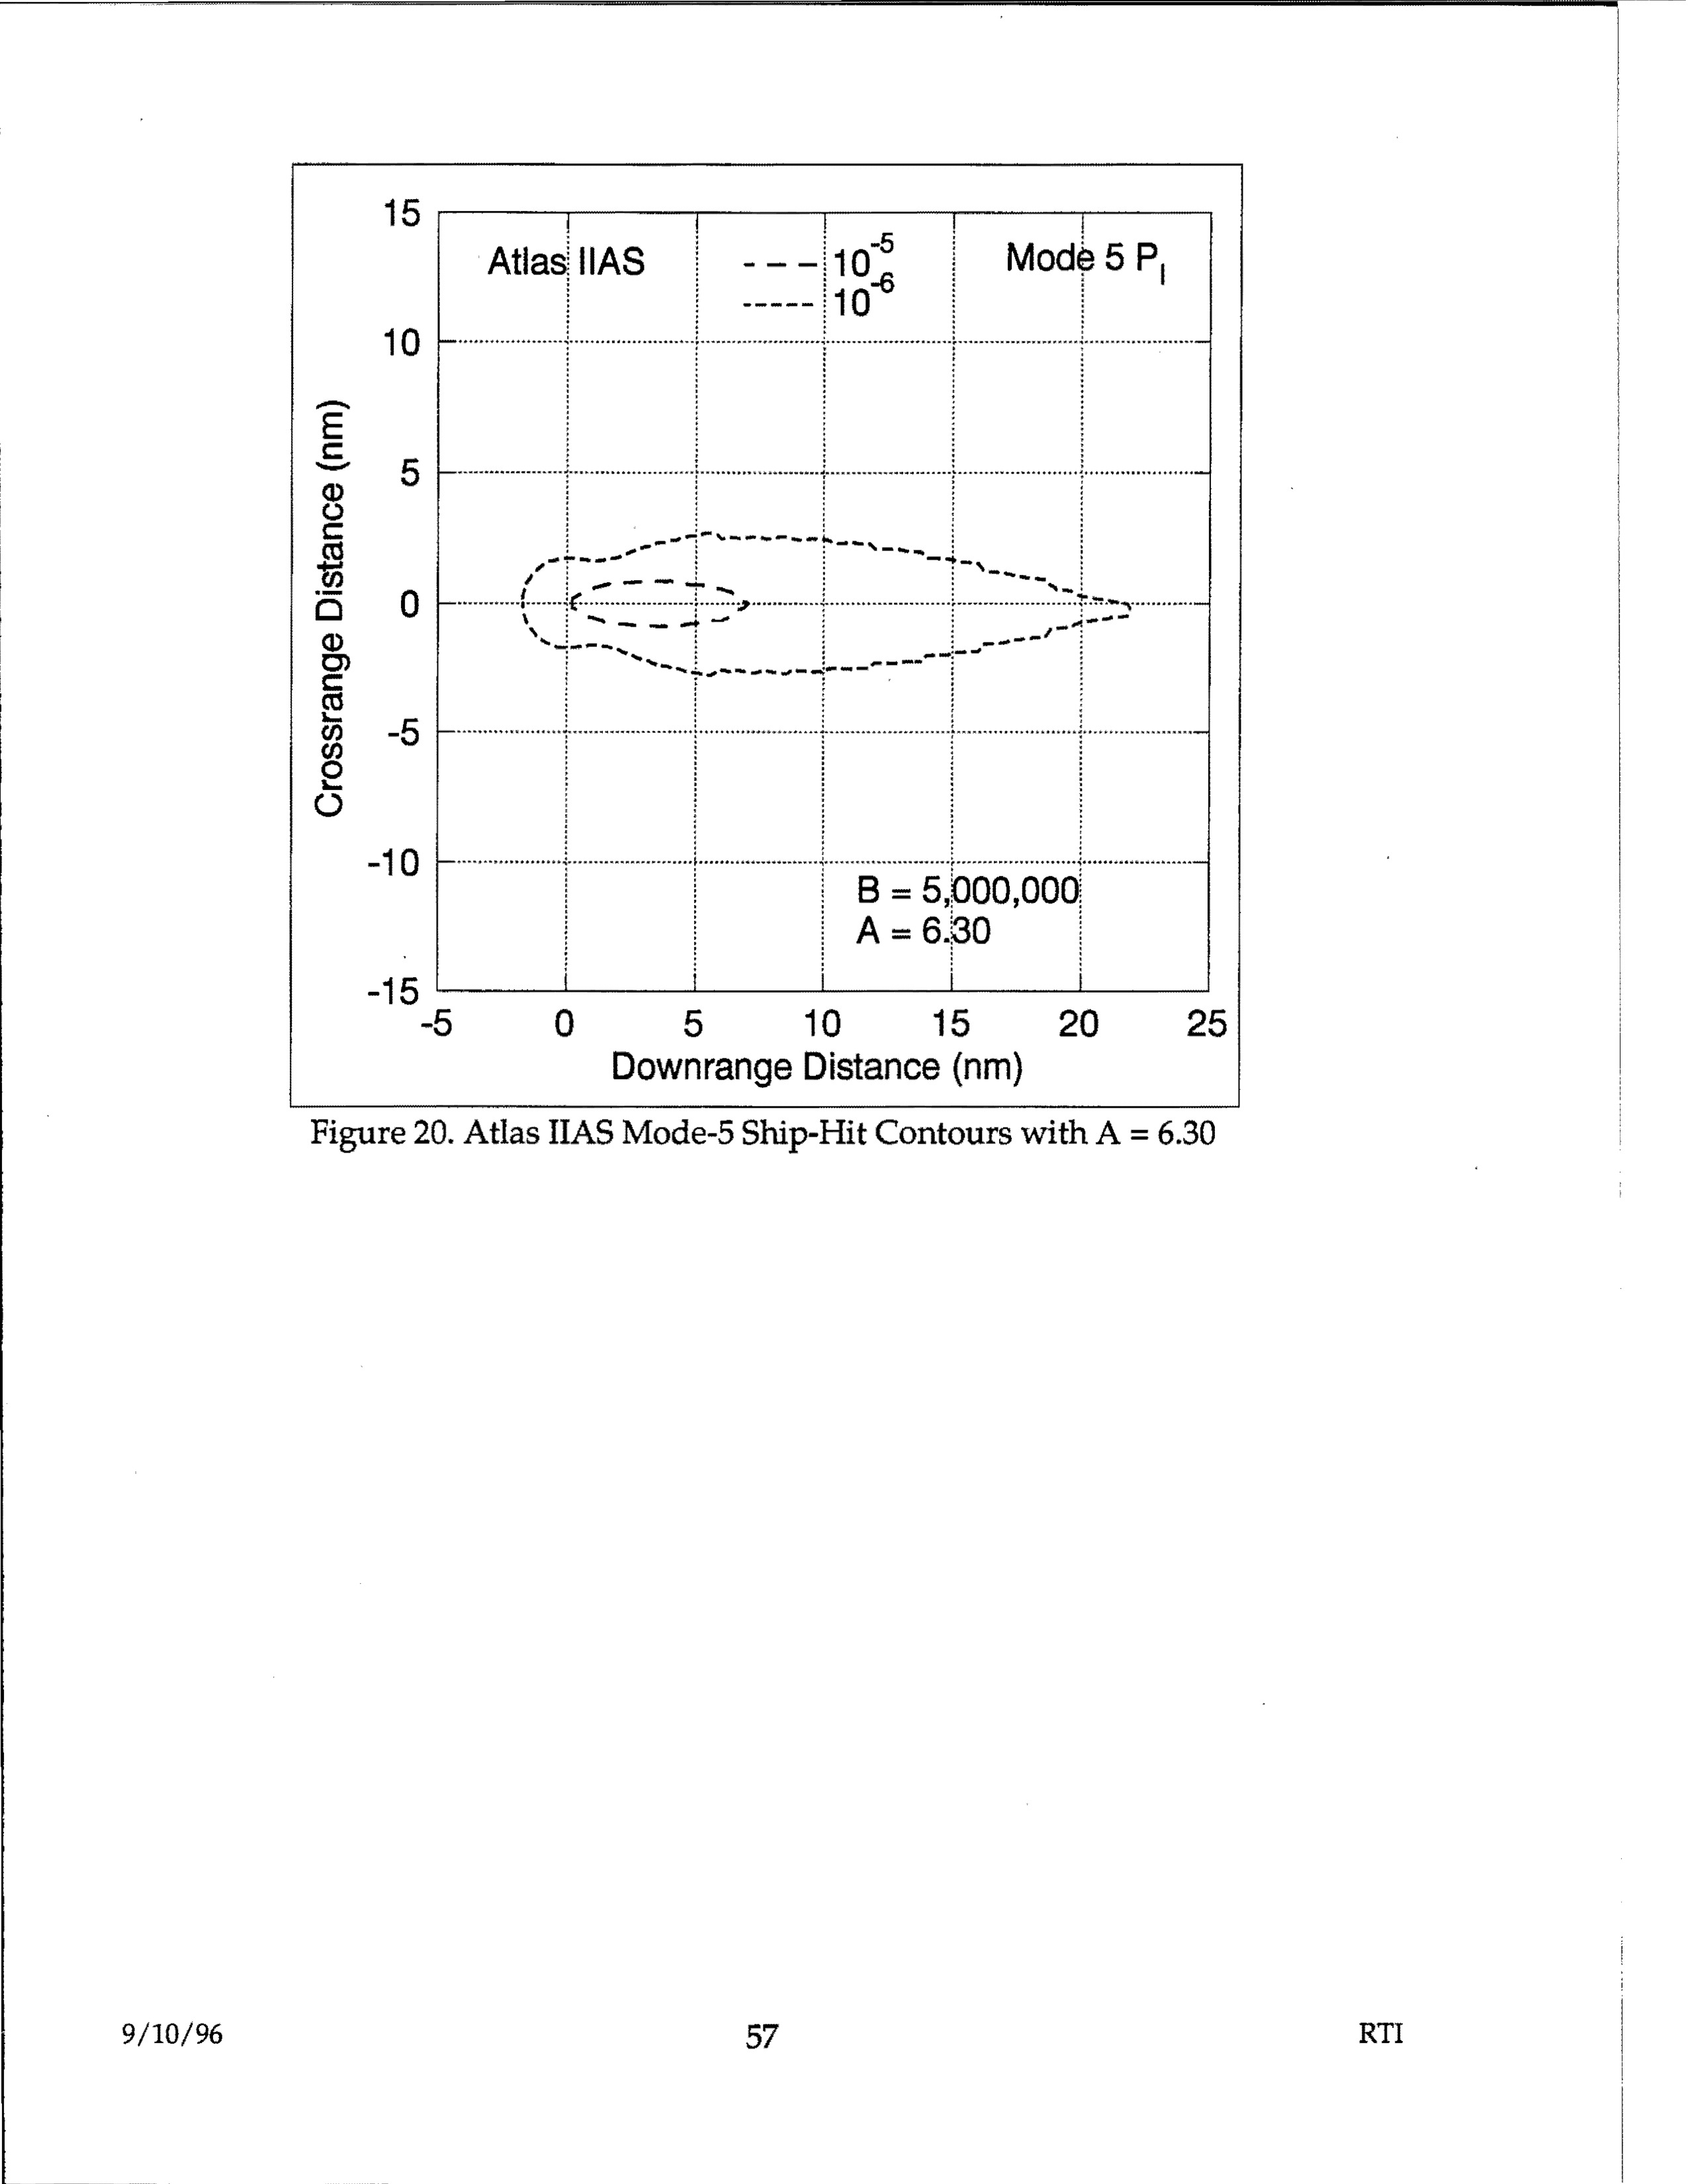
Atlas IIAS Mode-5 Ship-Hit Contours showing crossrange distance vs downrange distance with probability contours 10^-5 and 10^-6, B = 5,000,000, A = 6.30
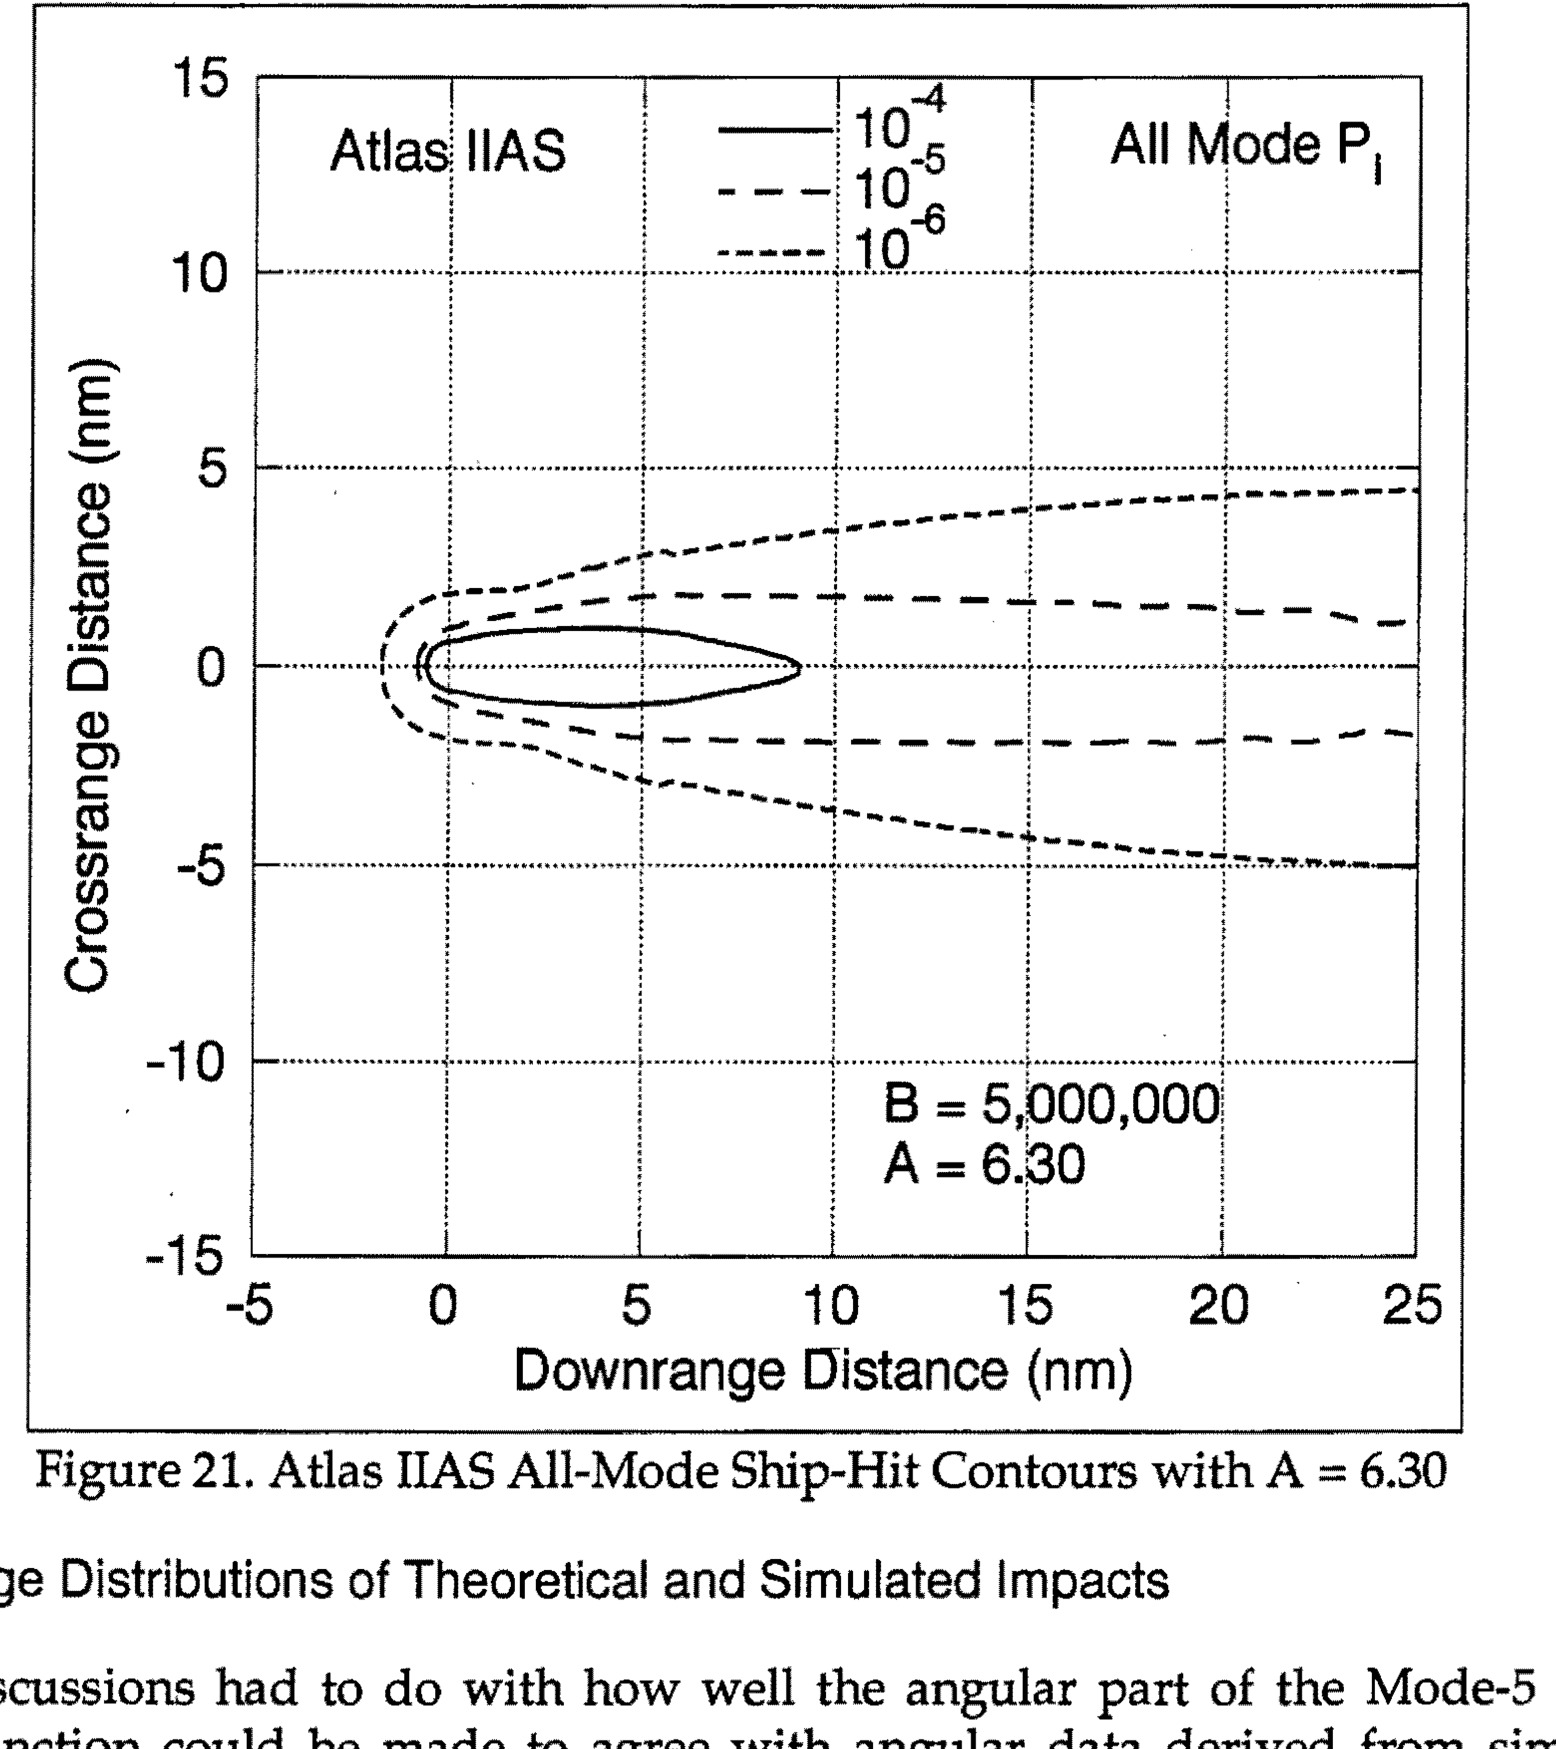
Figure 21. Atlas IIAS All-Mode Ship-Hit Contours with A = 6.30
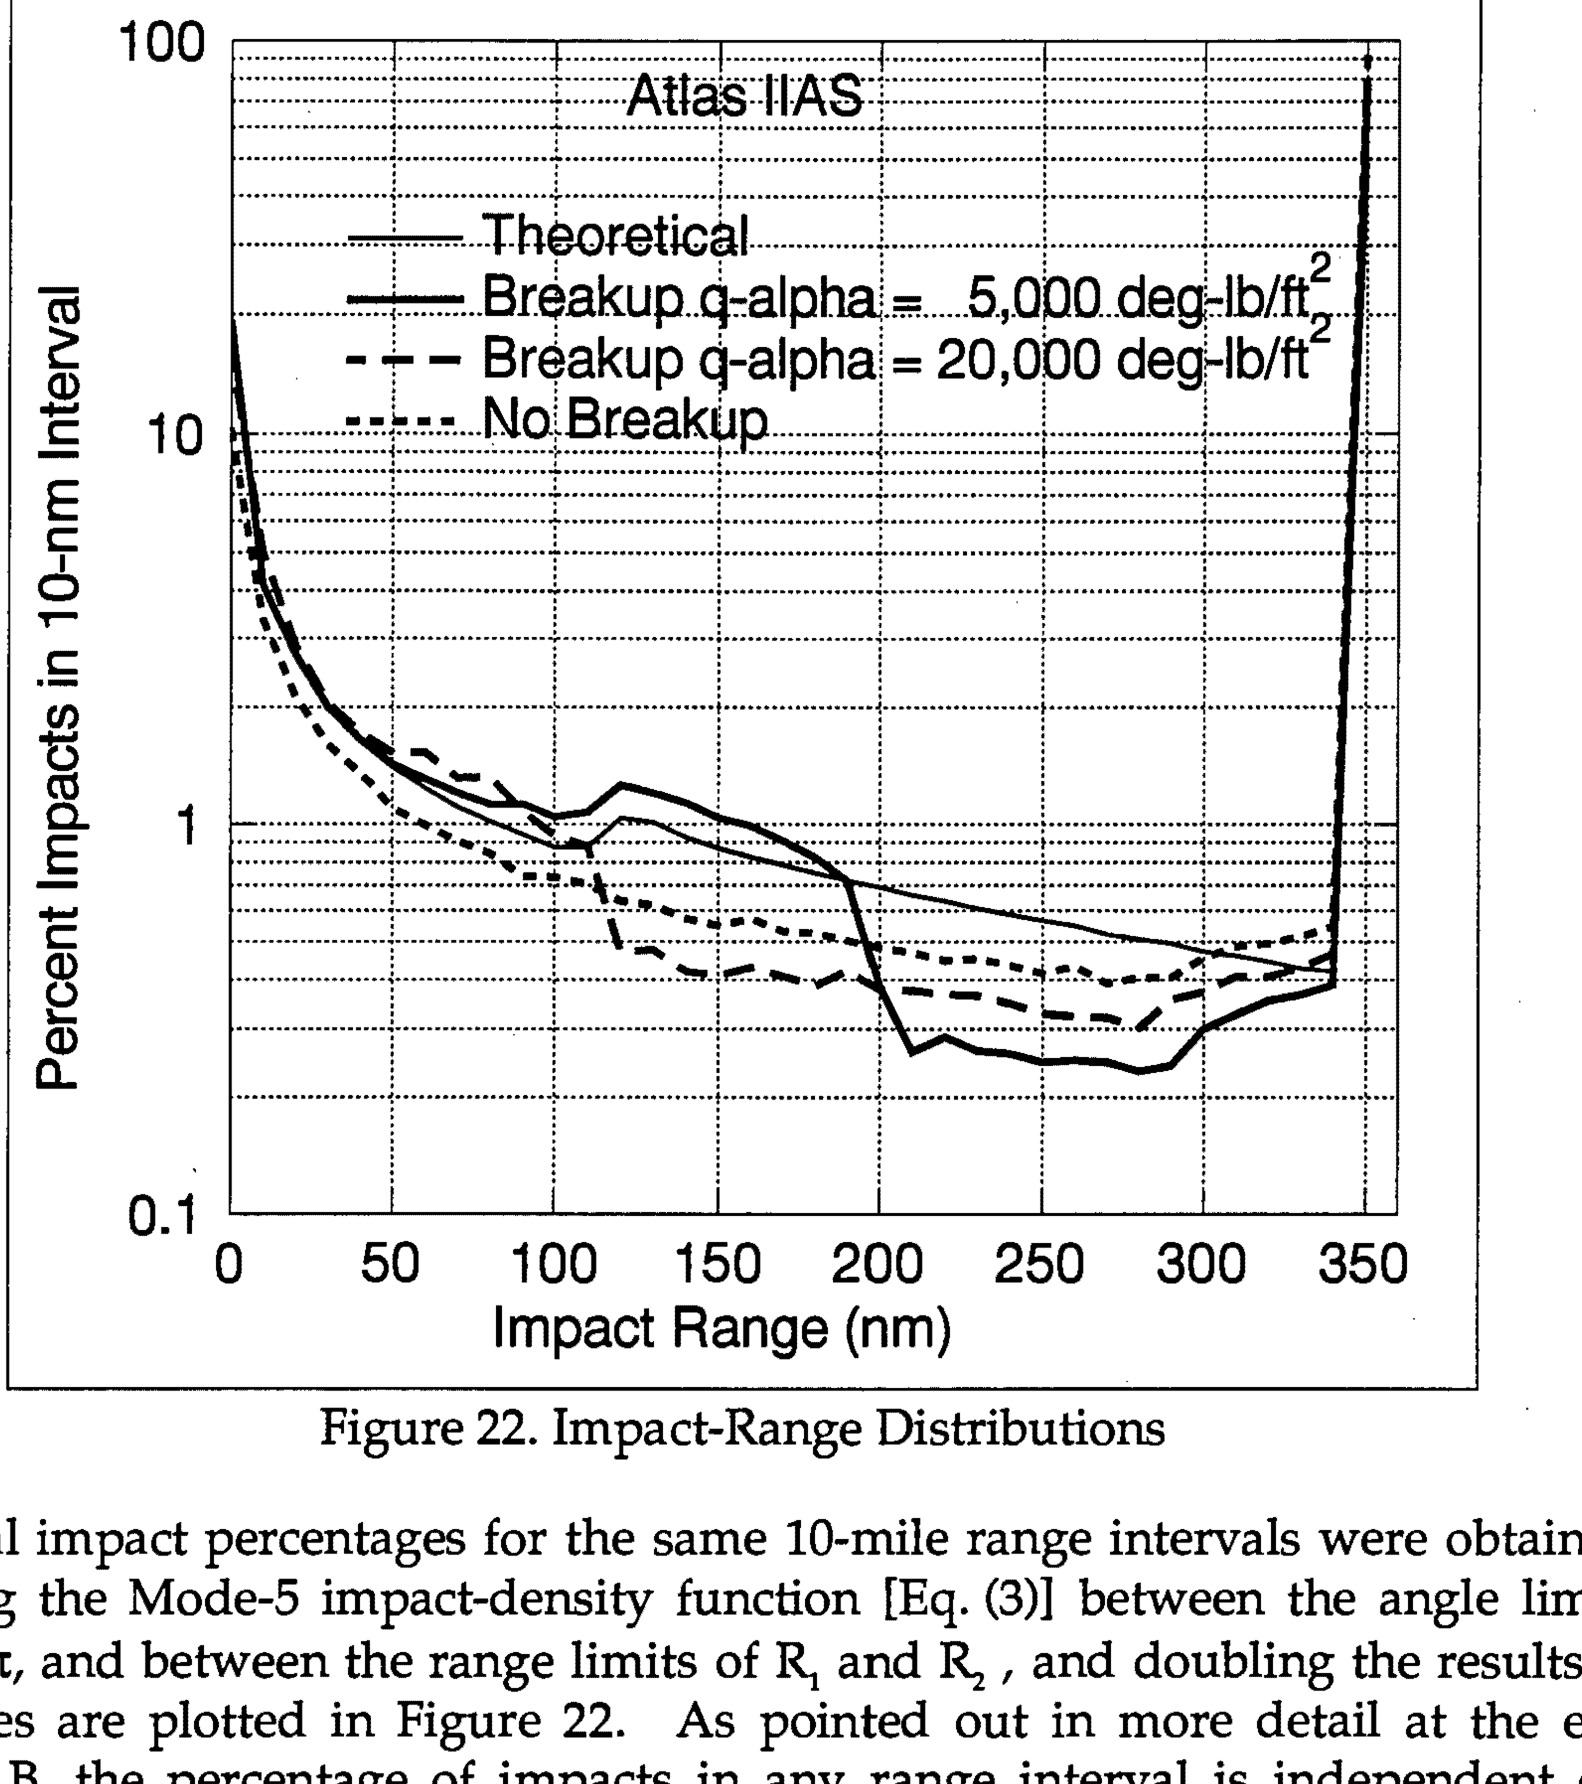
Figure 22. Impact-Range Distributions - Graph showing percent impacts in 10-nm interval vs impact range (nm) with Atlas IIAS theoretical and breakup q-alpha curves
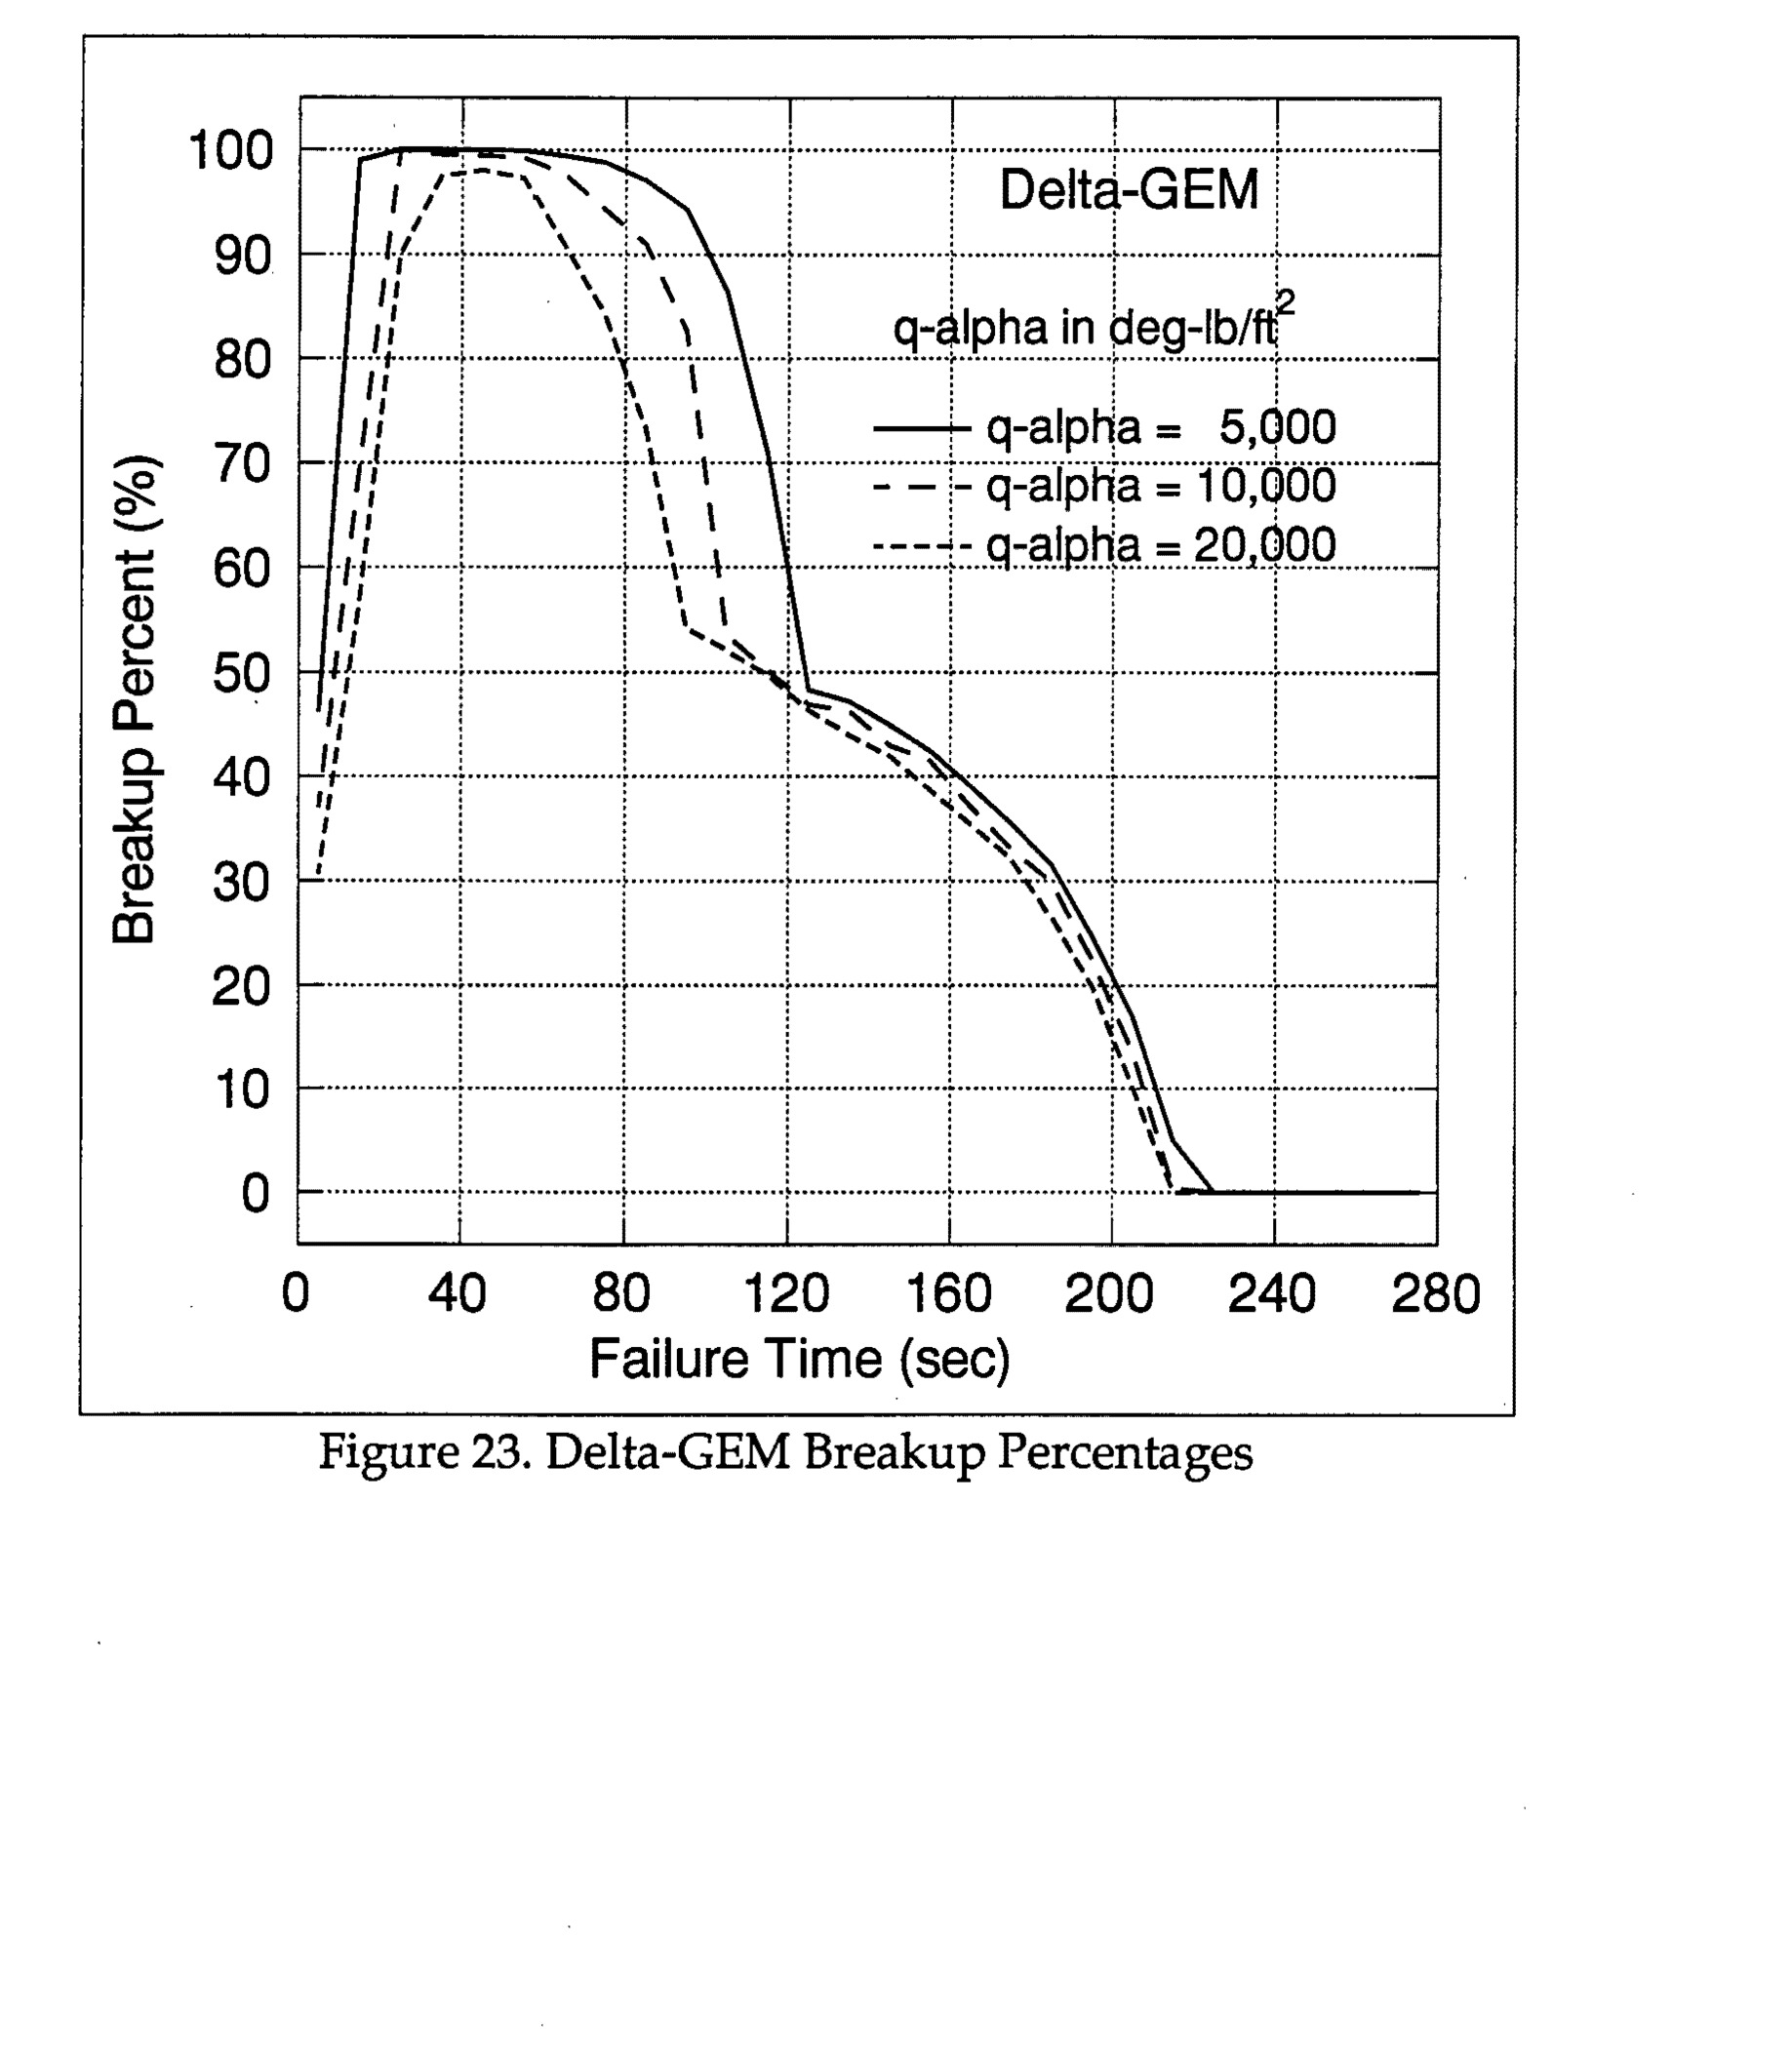
Figure 23. Delta-GEM Breakup Percentages - Graph showing breakup percent vs failure time for three q-alpha values (5,000, 10,000, and 20,000 deg-lb/ft²)
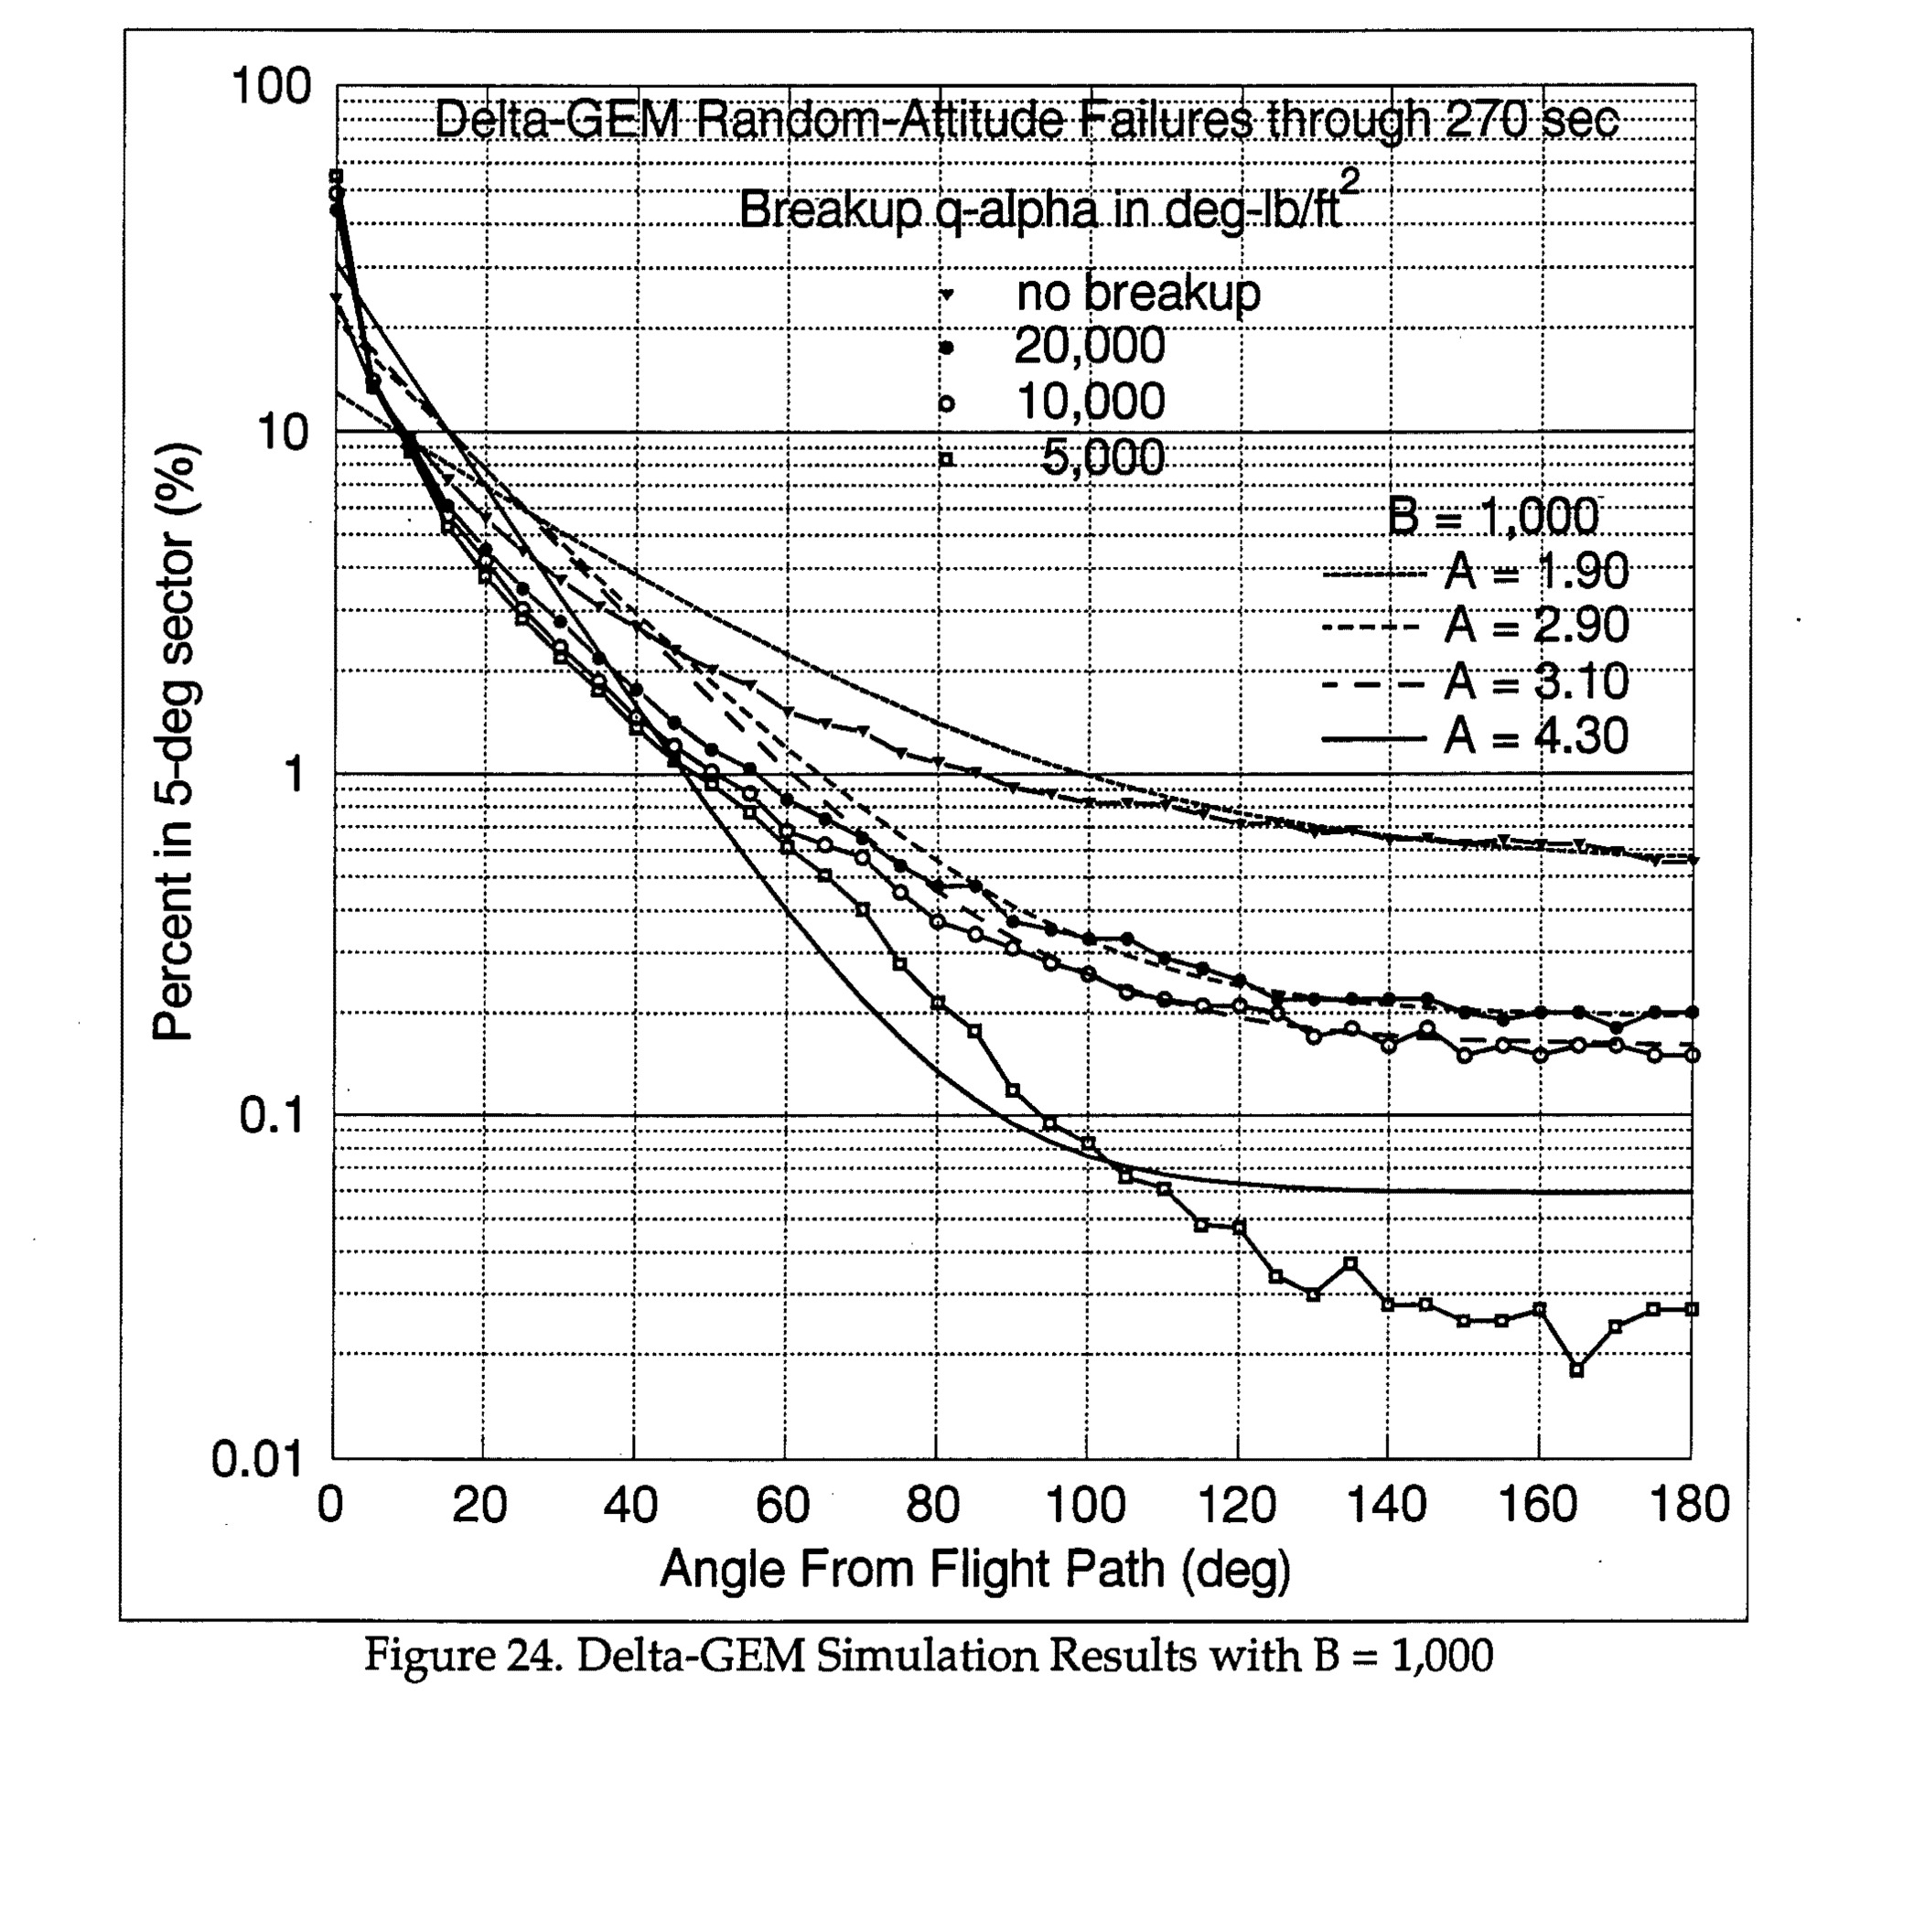
Delta-GEM Random-Altitude Failures through 270 sec, showing Percent in 5-deg sector vs Angle From Flight Path, with breakup q-alpha values and theoretical Mode-5 curves for various A values with B=1,000
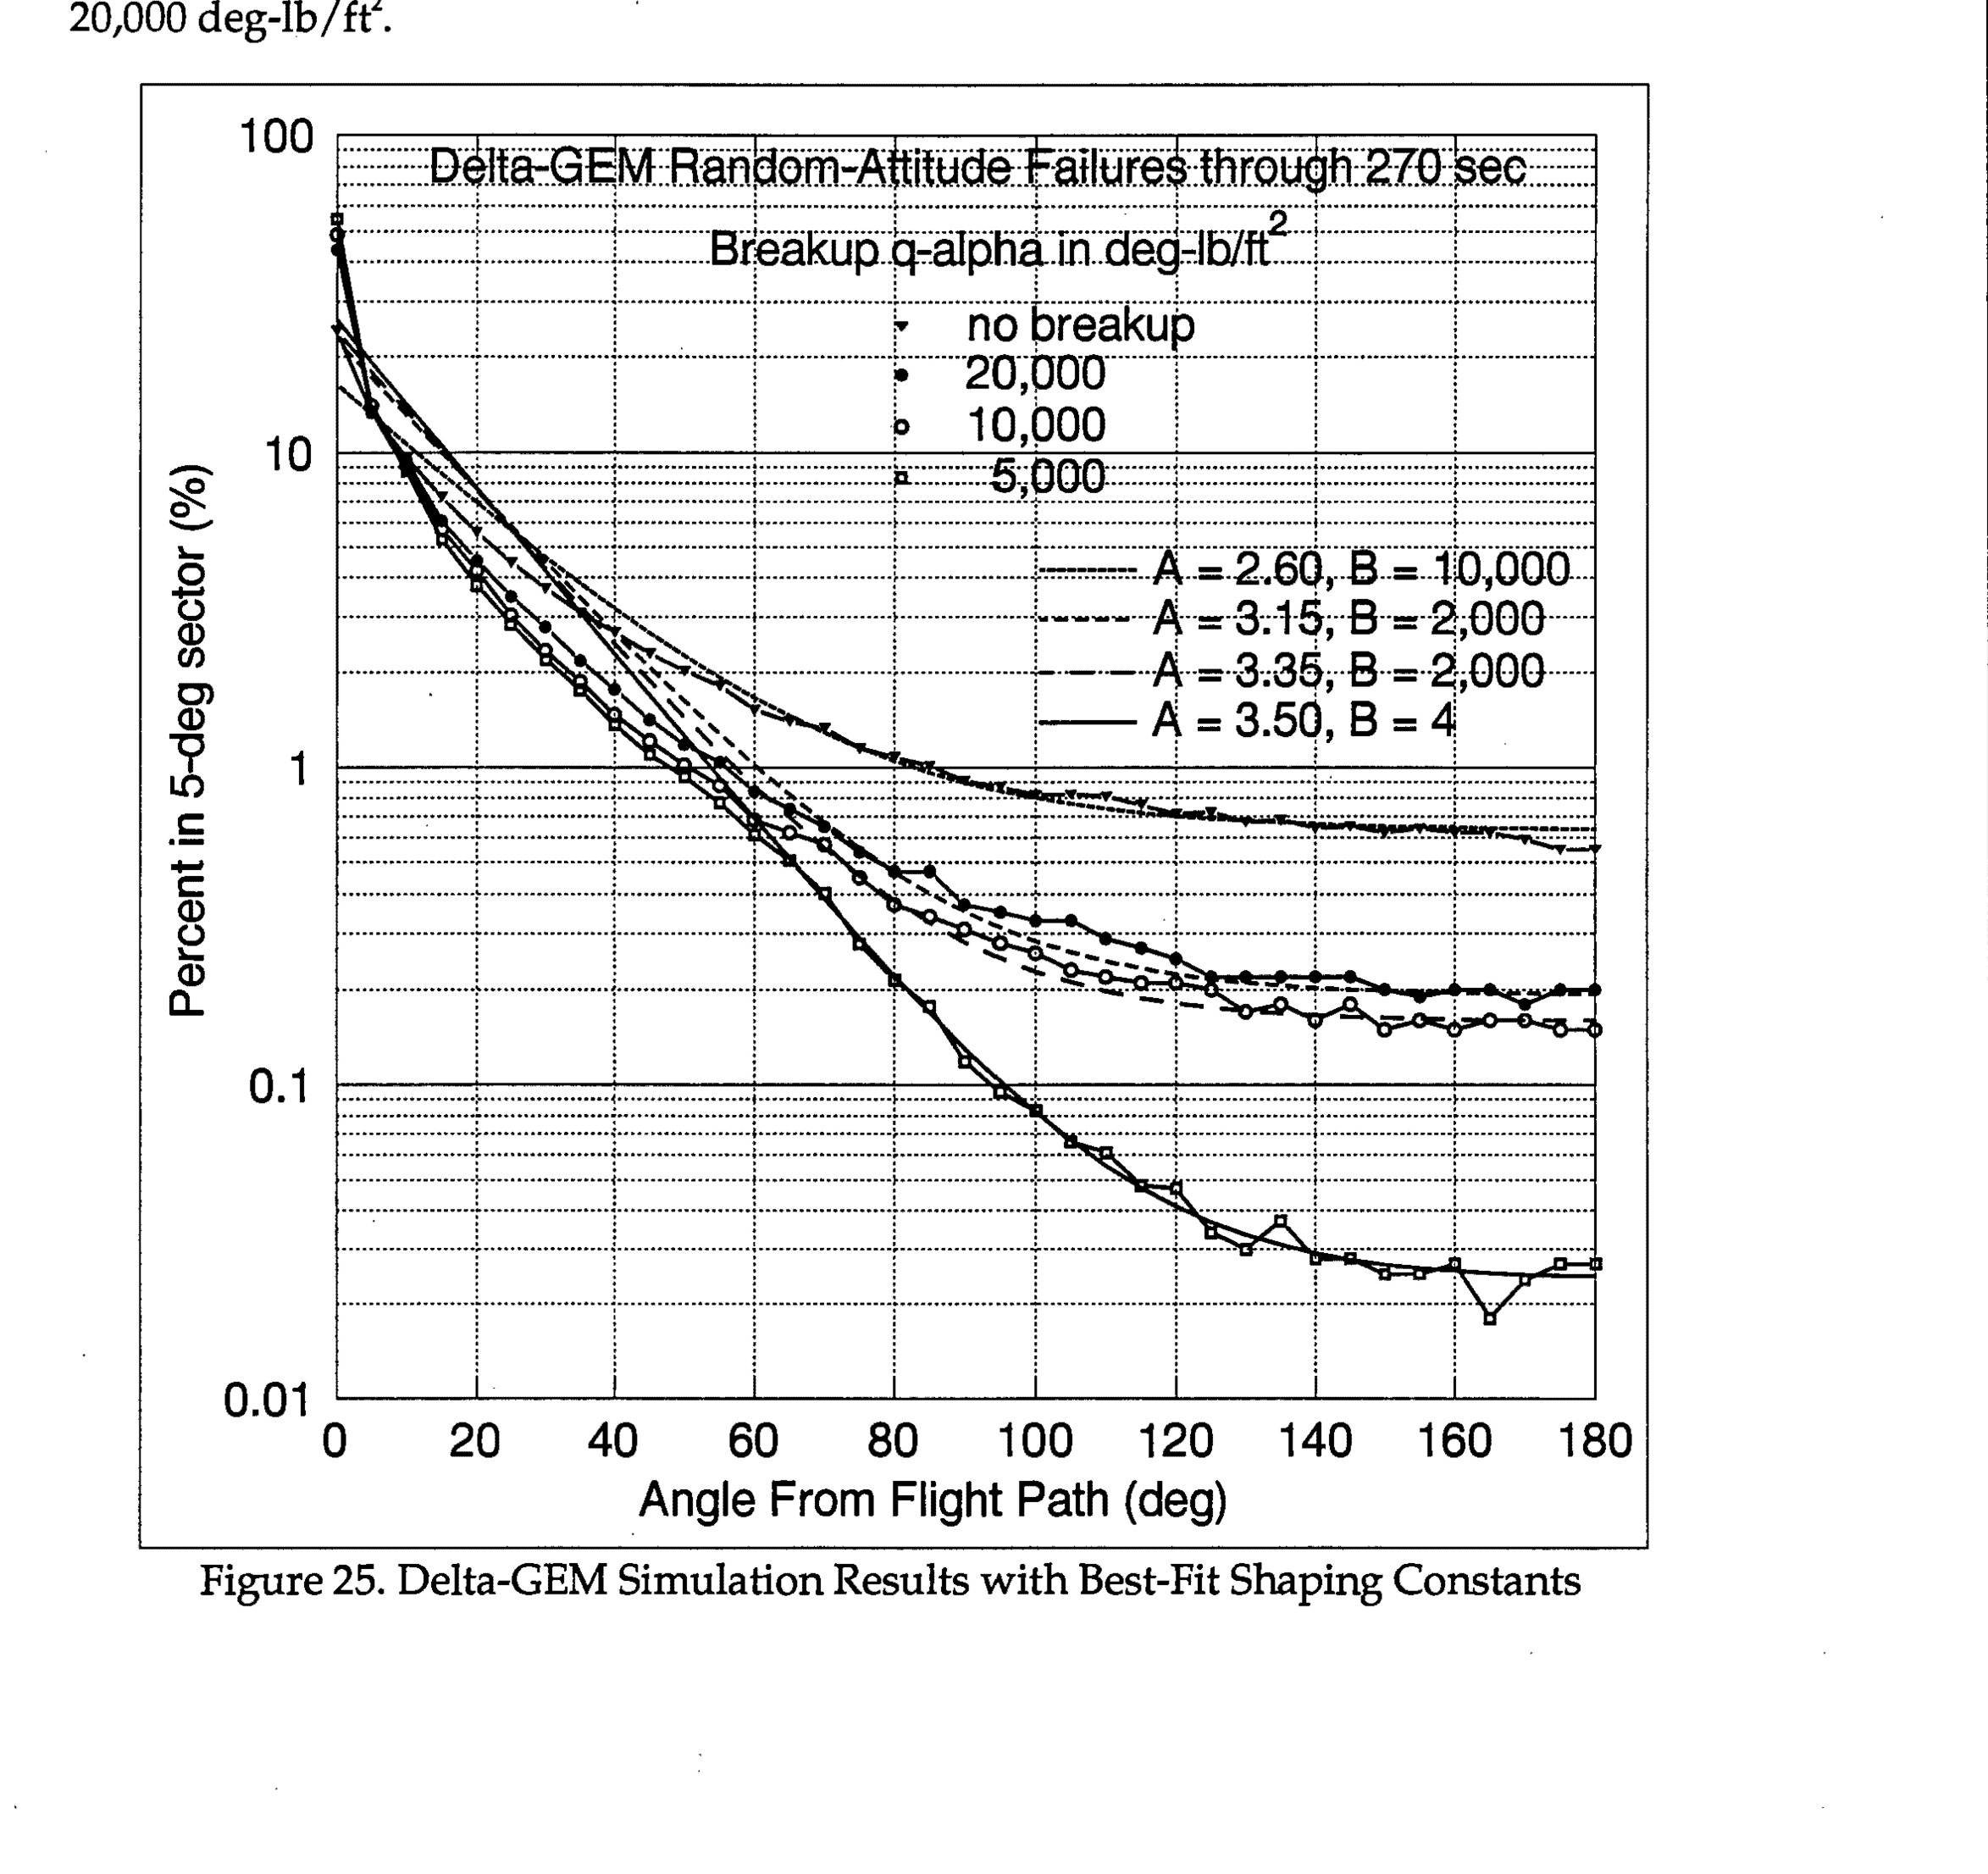
Delta-GEM Simulation Results with Best-Fit Shaping Constants showing percent in 5-deg sector vs angle from flight path for various breakup q-alpha values
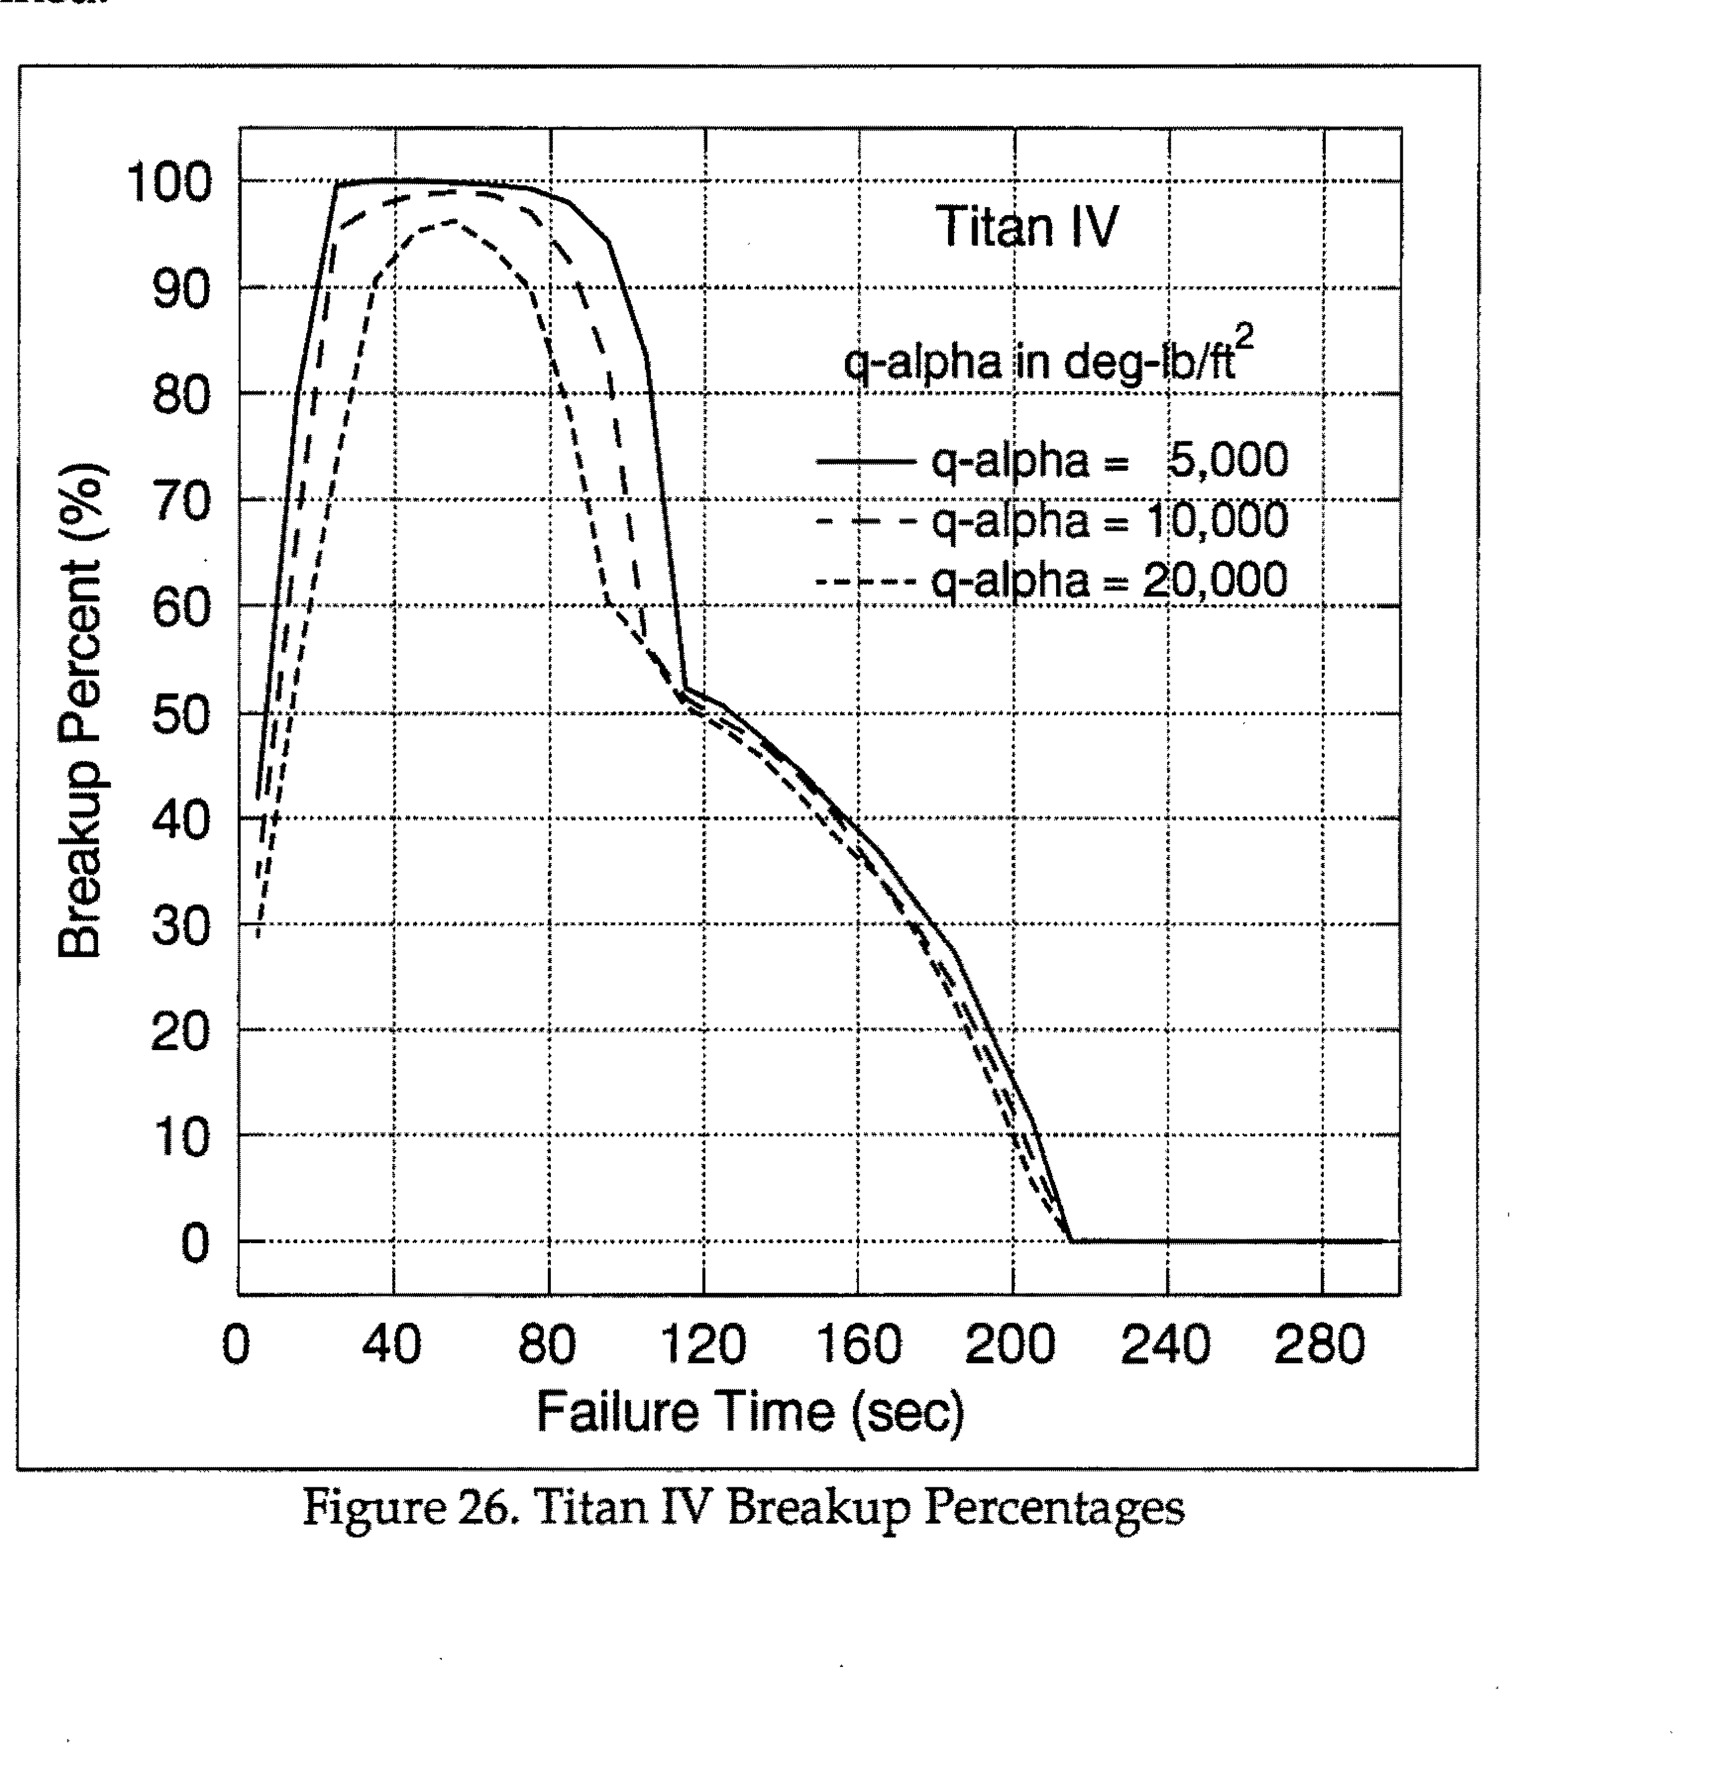
Figure 26. Titan IV Breakup Percentages - Graph showing Breakup Percent (%) vs Failure Time (sec) for three q-alpha values: 5,000, 10,000, and 20,000 deg-lb/ft²
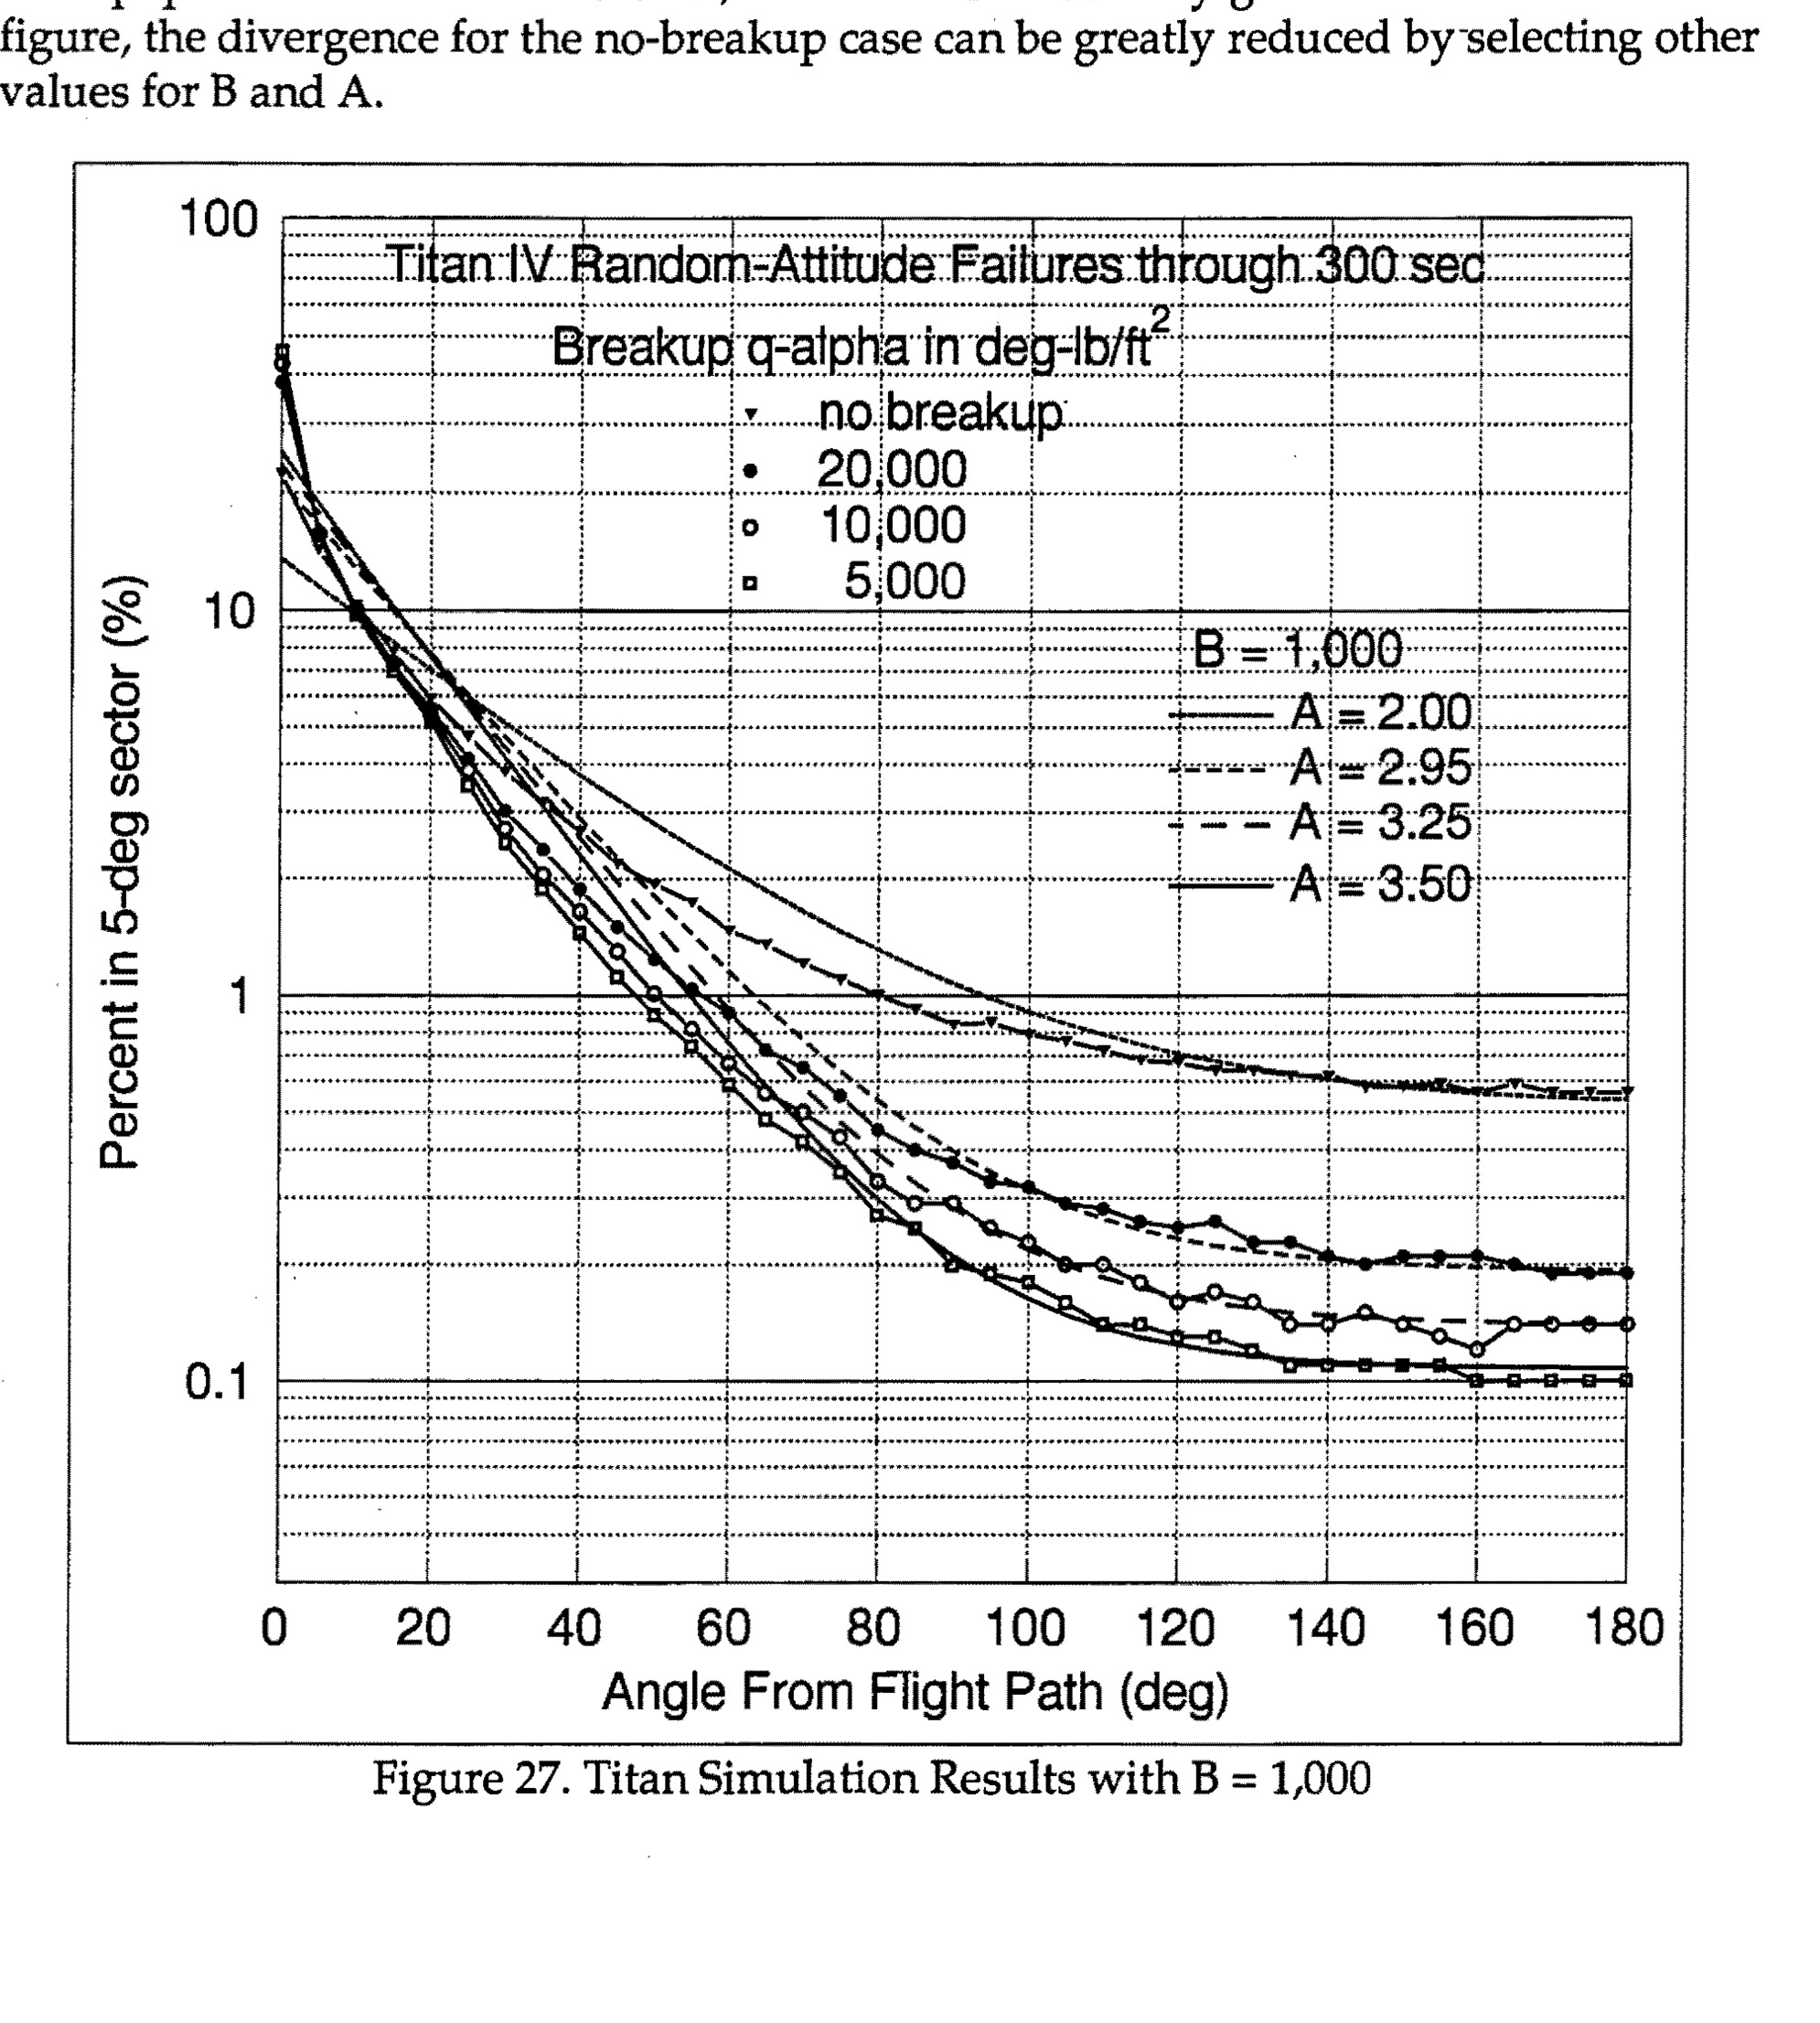
Figure 27. Titan Simulation Results with B = 1,000 - Graph showing Percent in 5-deg sector vs Angle From Flight Path (deg) with multiple curves for different breakup q-alpha values and no breakup scenarios
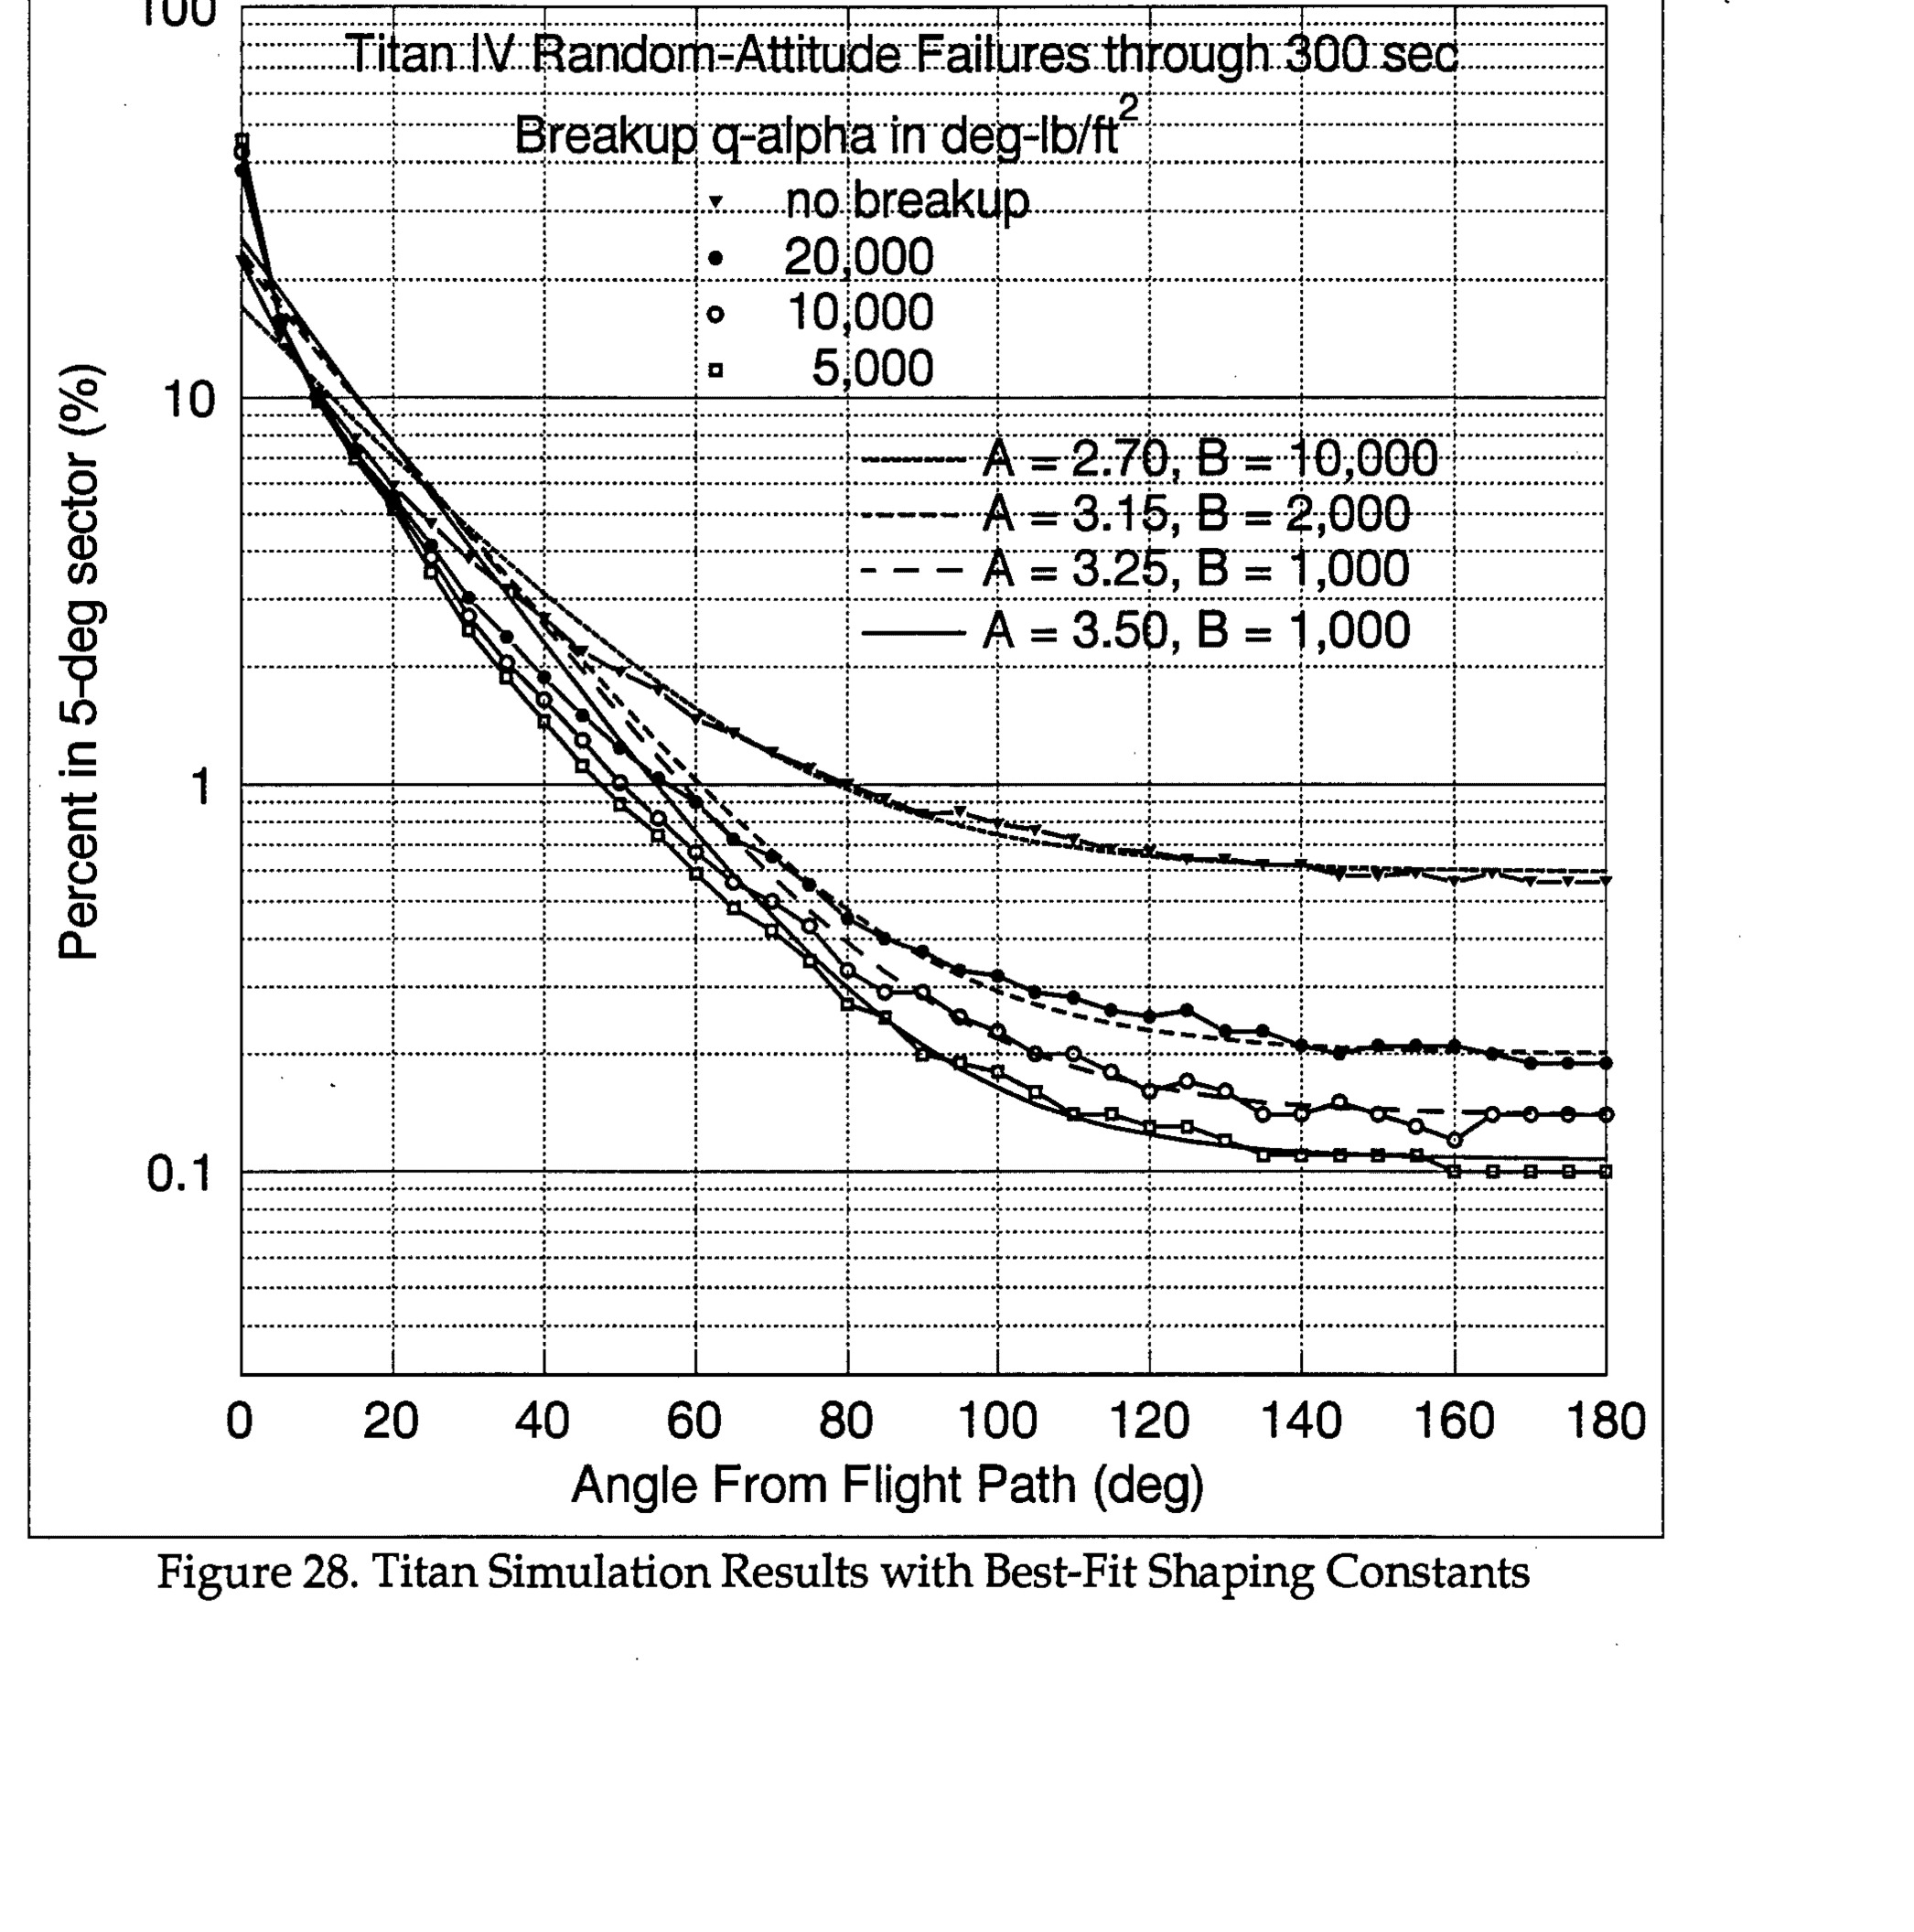
Titan IV Random-Attitude Failures through 300 sec, showing Breakup α-alpha in deg-lb/ft² with various parameters (no breakup, 20,000, 10,000, 5,000) and curves for A=2.70, B=10,000; A=3.15, B=2,000; A=3.25, B=1,000; A=3.50, B=1,000. Y-axis: Percent in 5-deg sector (%), logarithmic scale 0.1 to 100. X-axis: Angle From Flight Path (deg), 0 to 180.
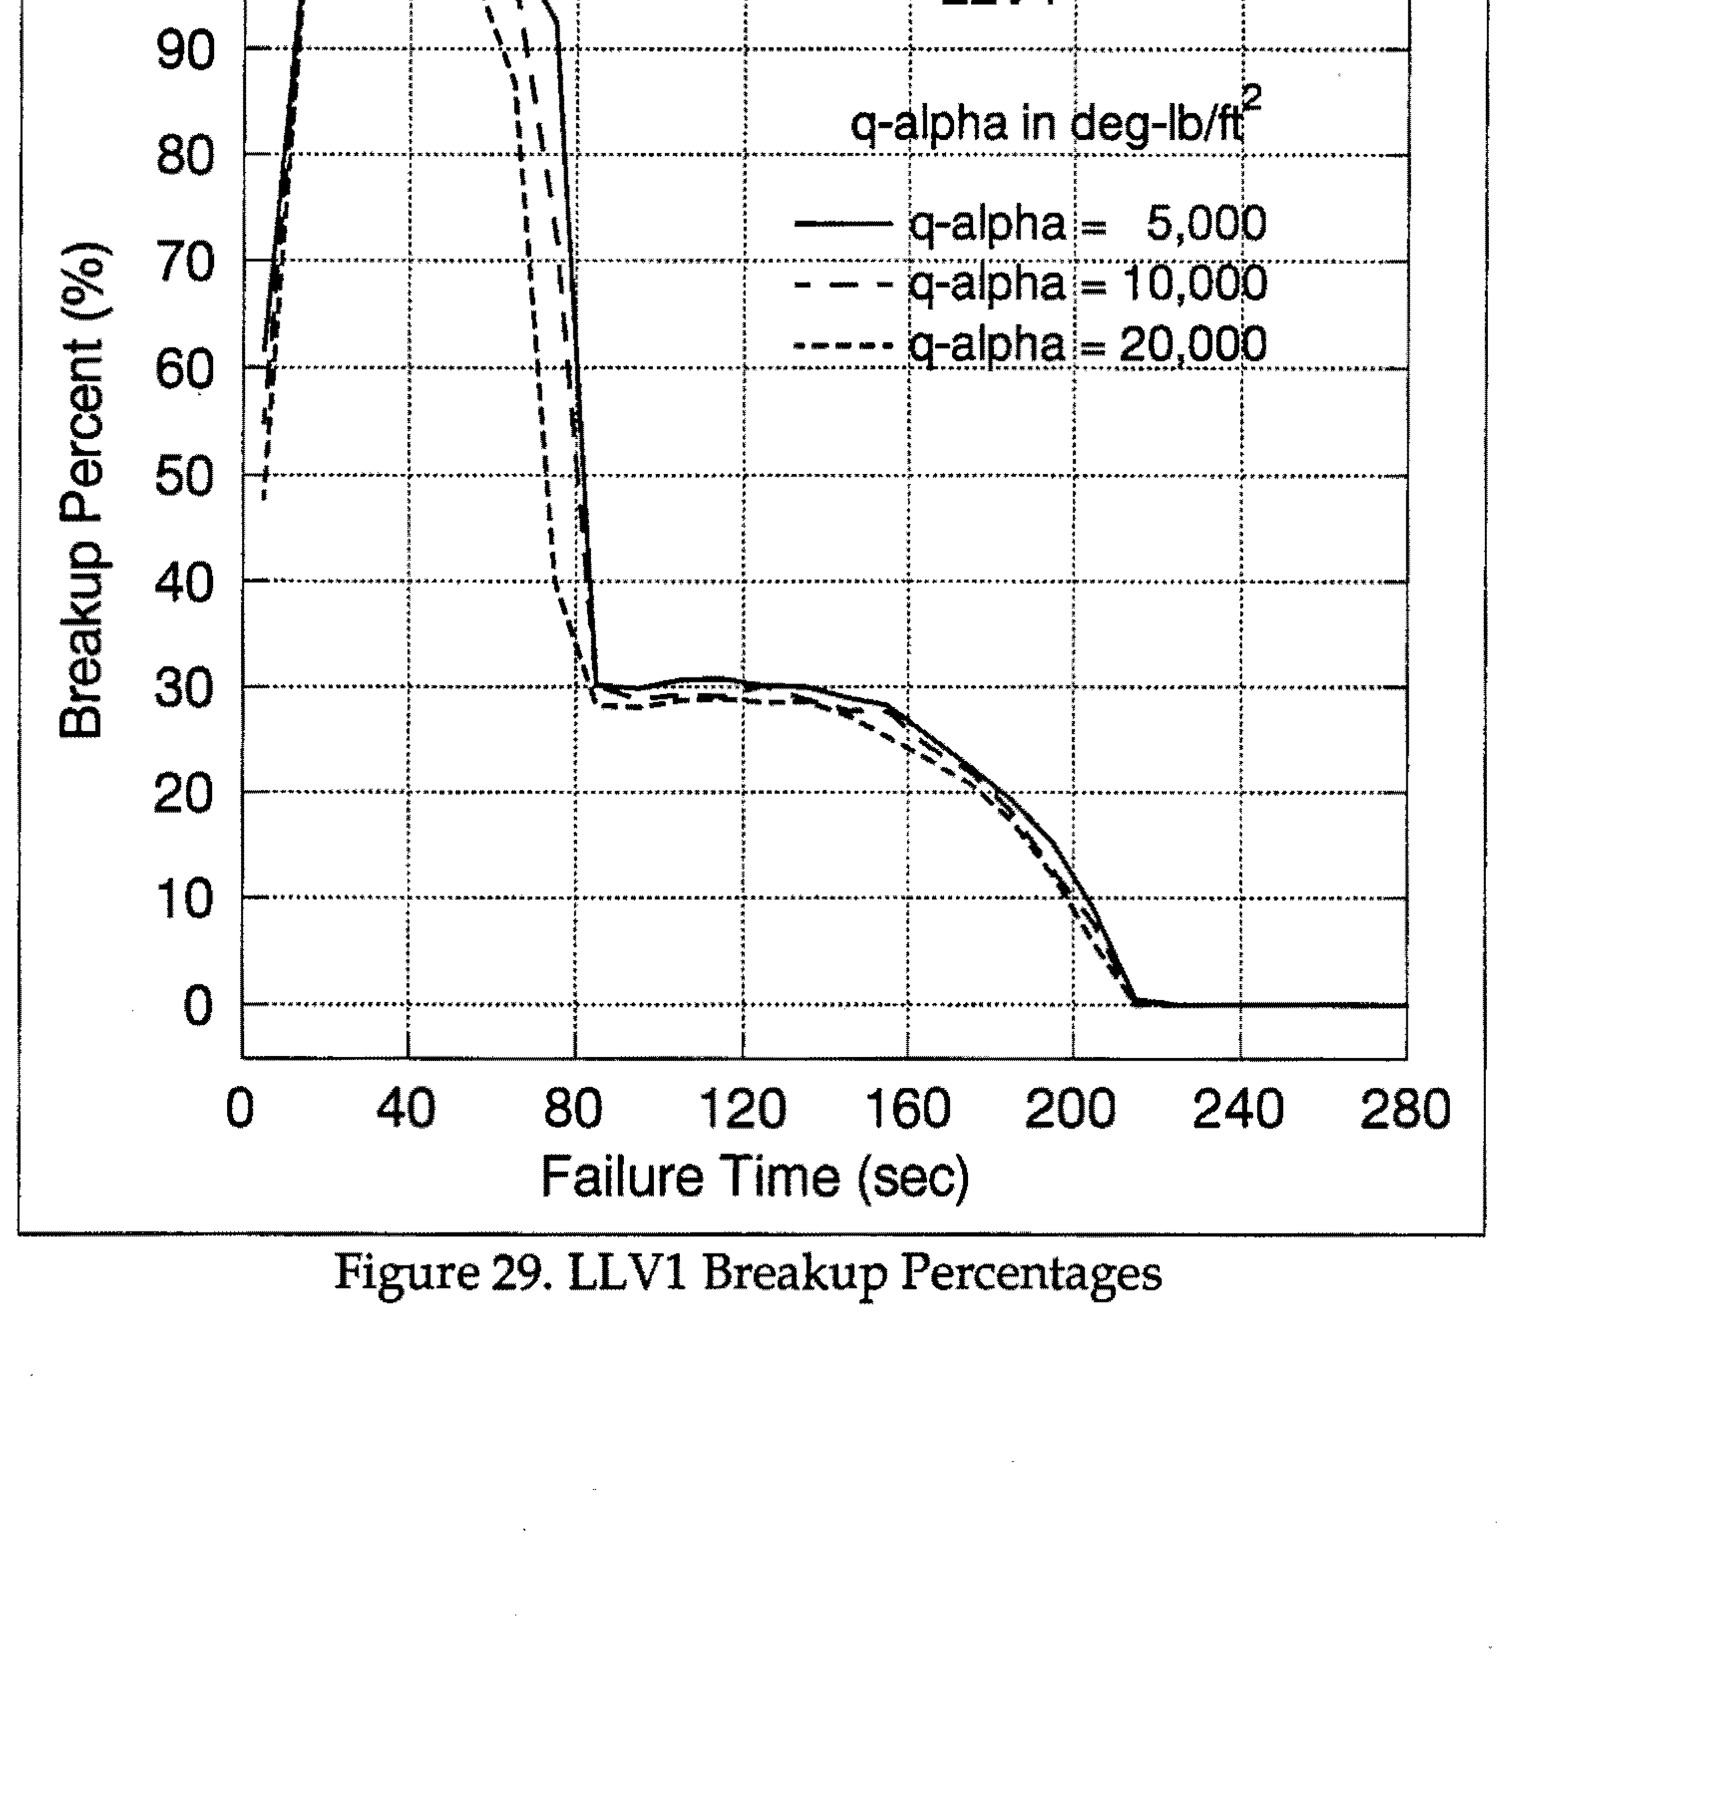
Figure 29. LLV1 Breakup Percentages - Graph showing breakup percent vs failure time with three curves for q-alpha values of 5,000, 10,000, and 20,000 deg-lb/ft²
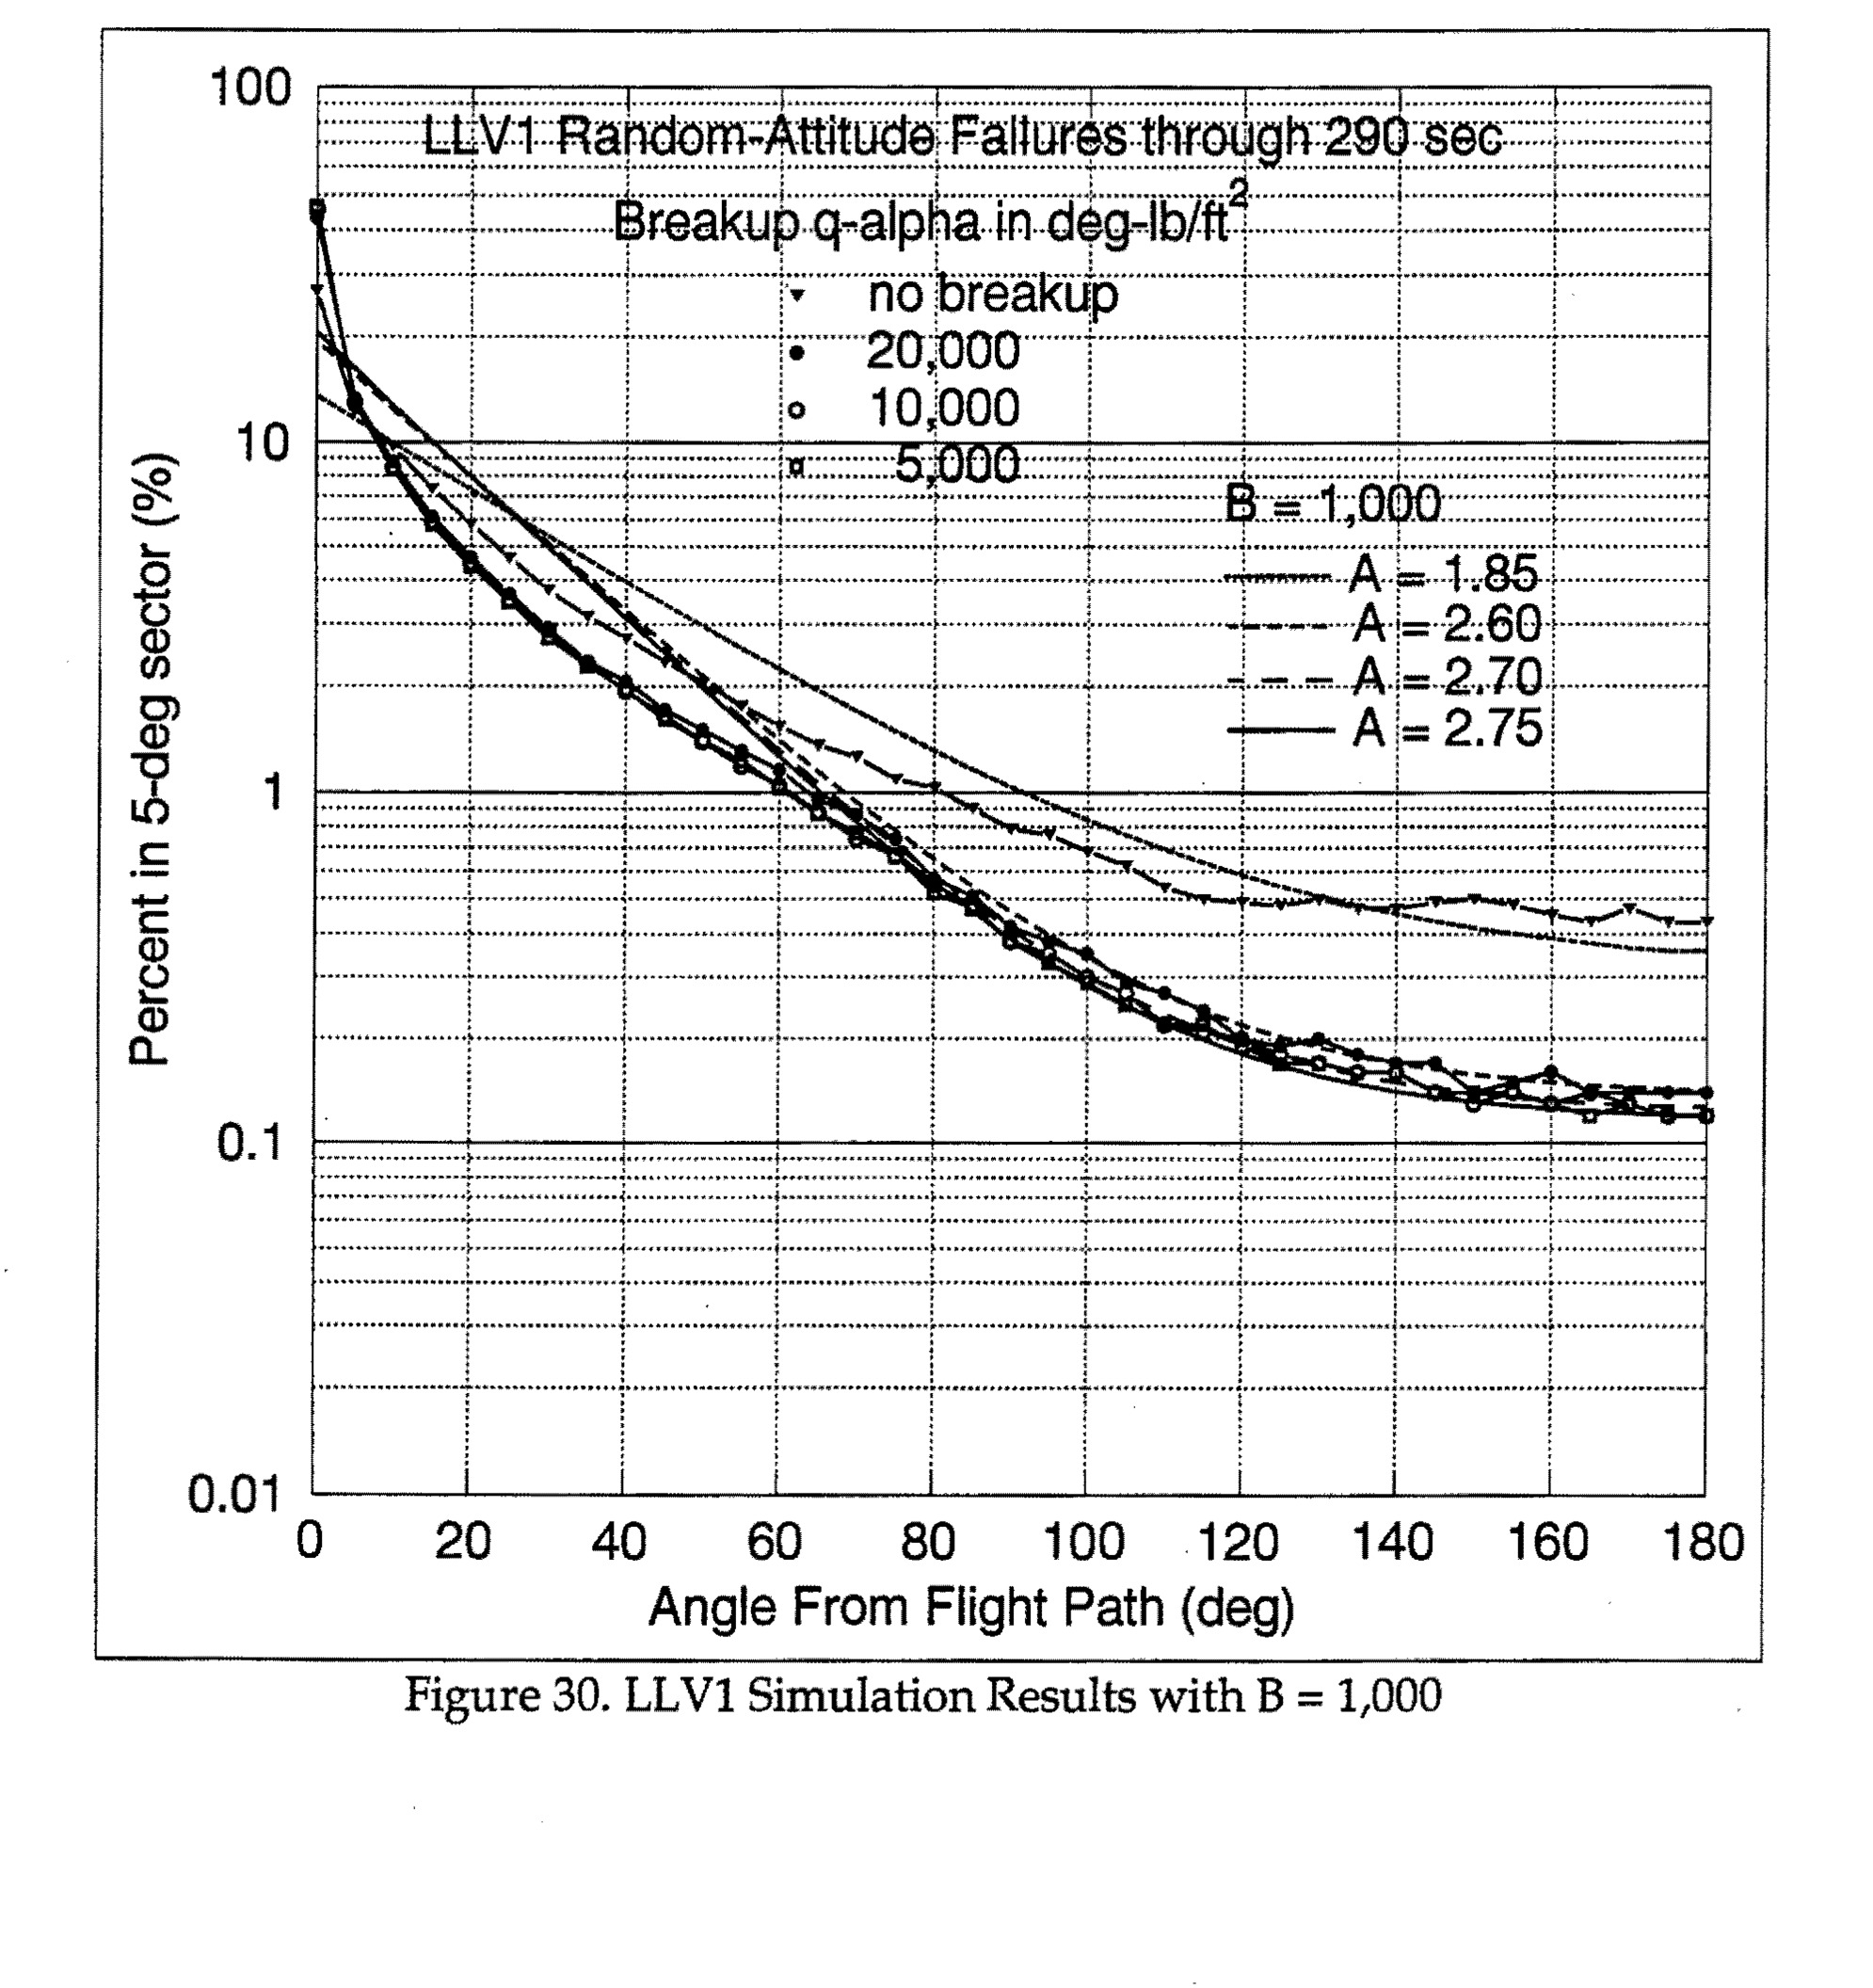
Figure 30. LLV1 Simulation Results with B = 1,000 - Graph showing percent in 5-deg sector vs angle from flight path, with multiple curves for different breakup q-alpha values and A values
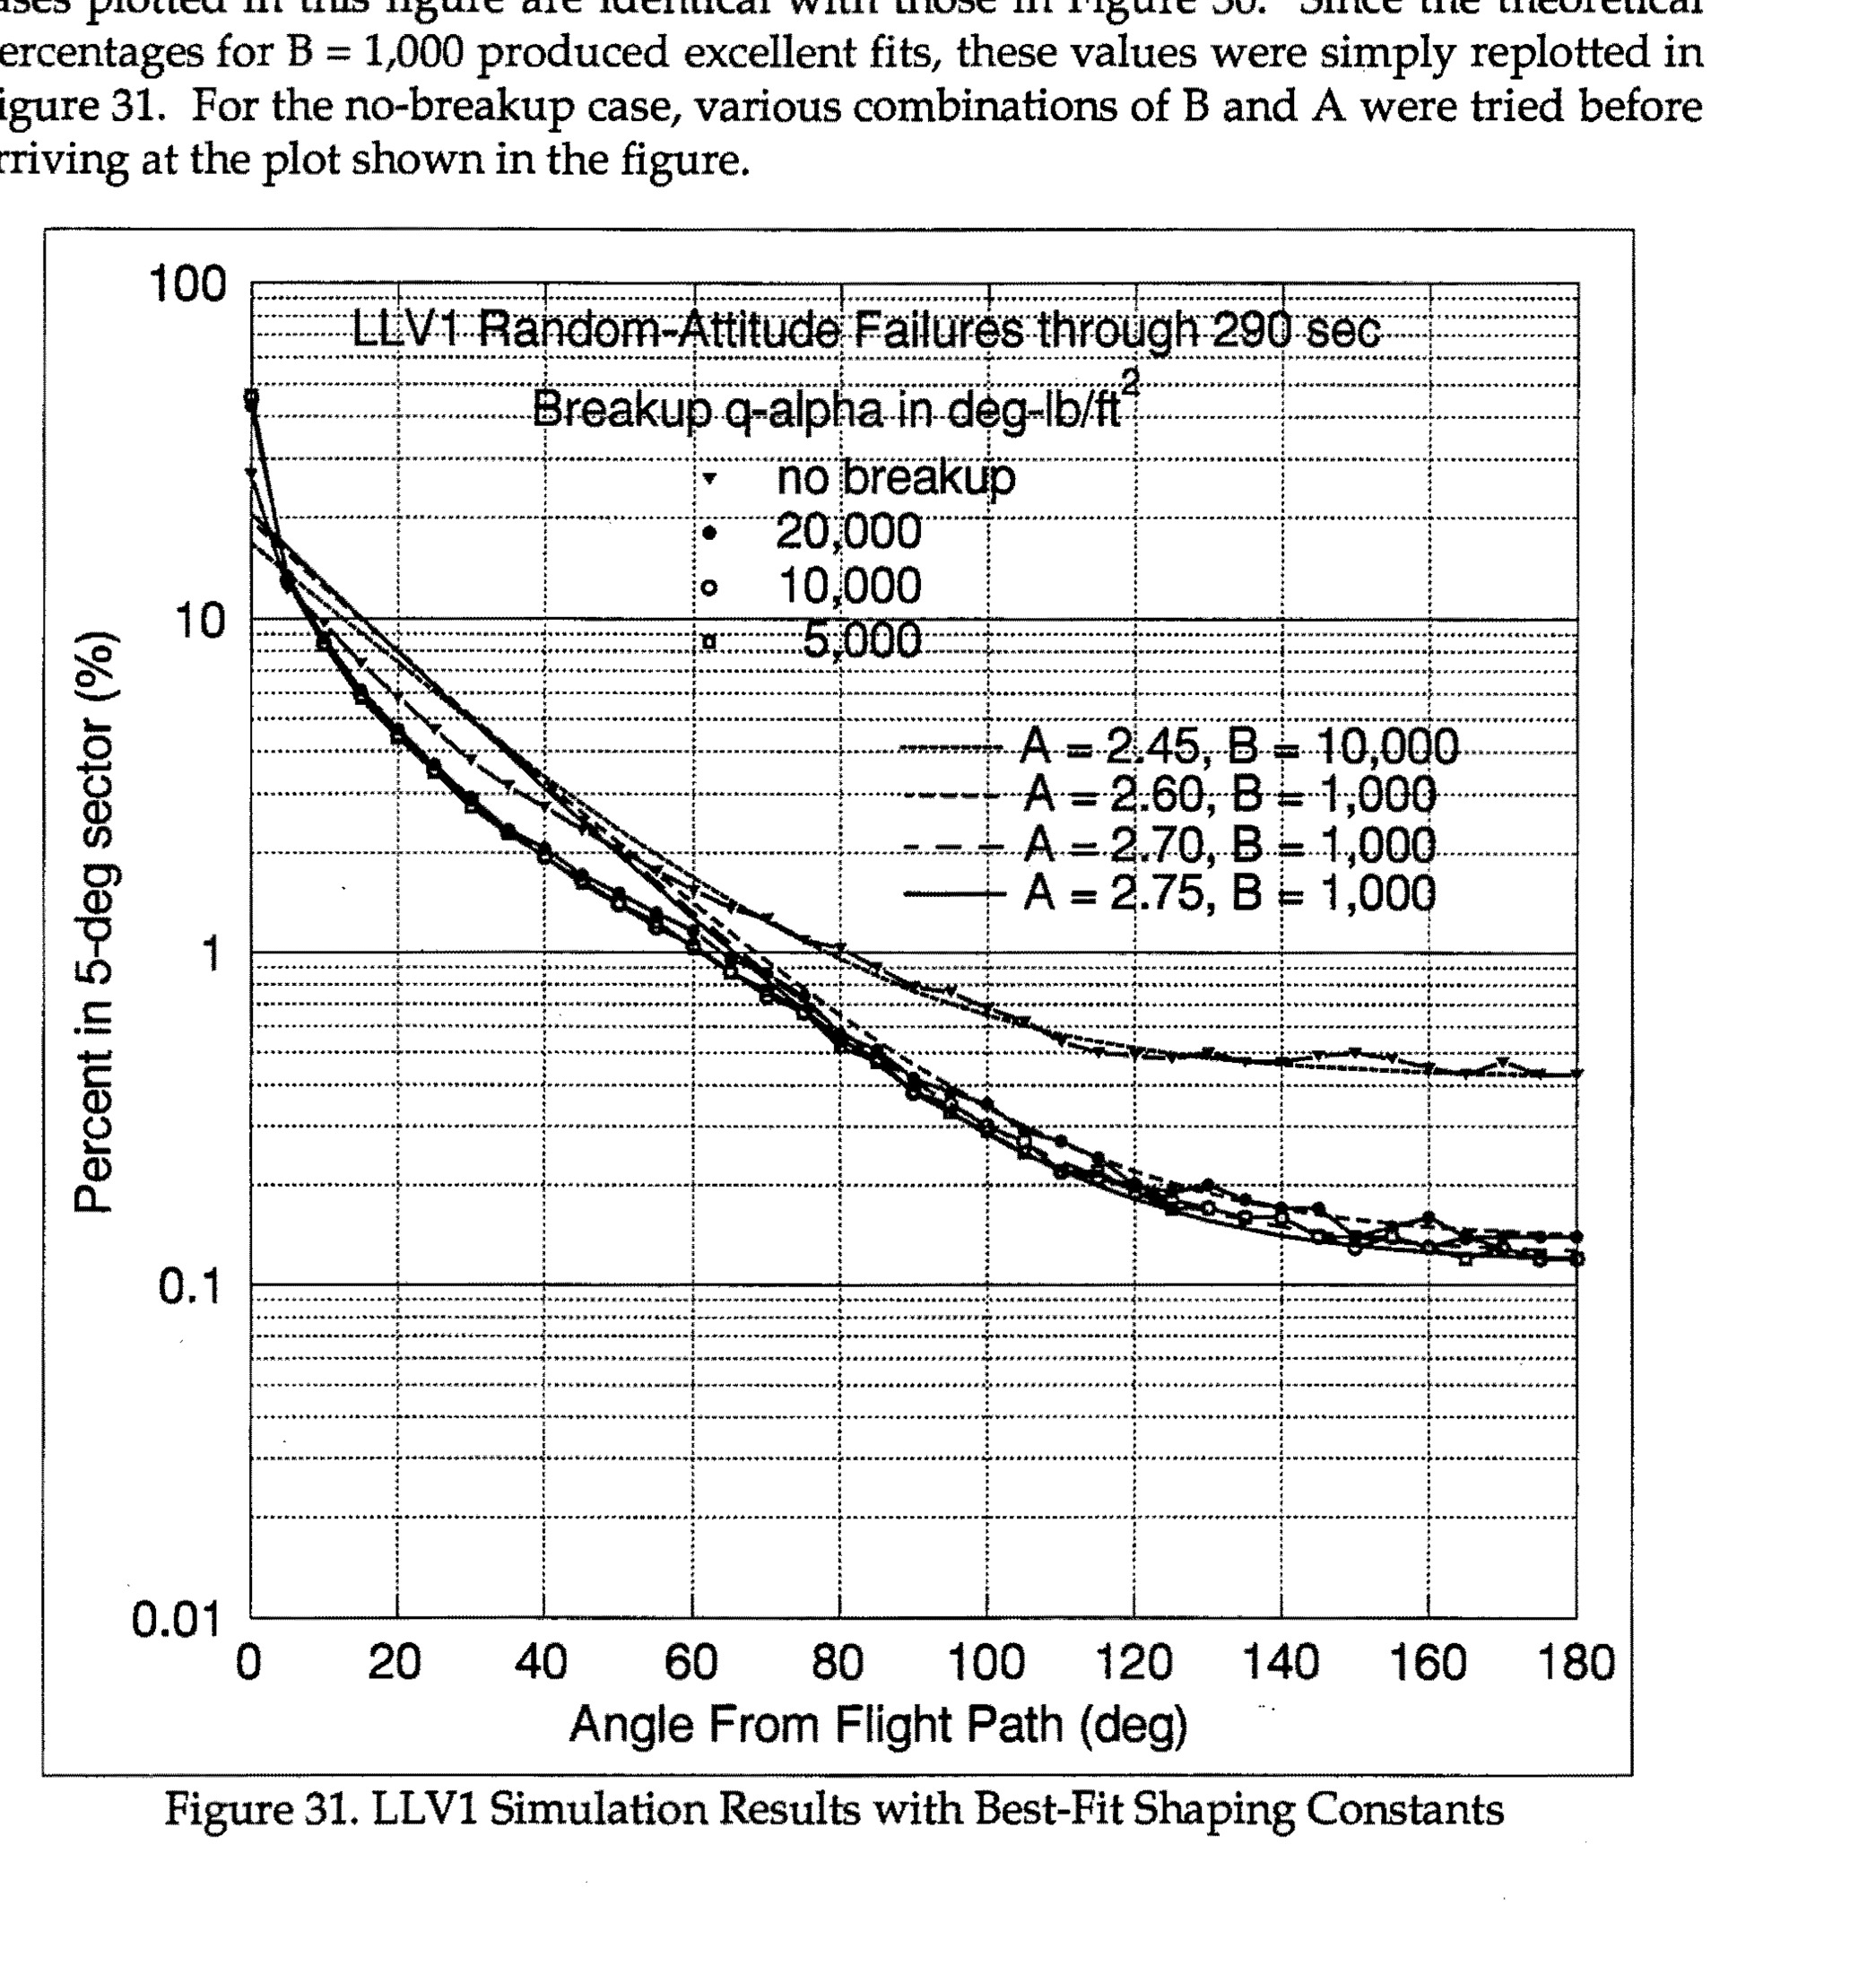
LLV1 Simulation Results with Best-Fit Shaping Constants showing percent in 5-deg sector vs angle from flight path for various breakup q-alpha values and shaping constants
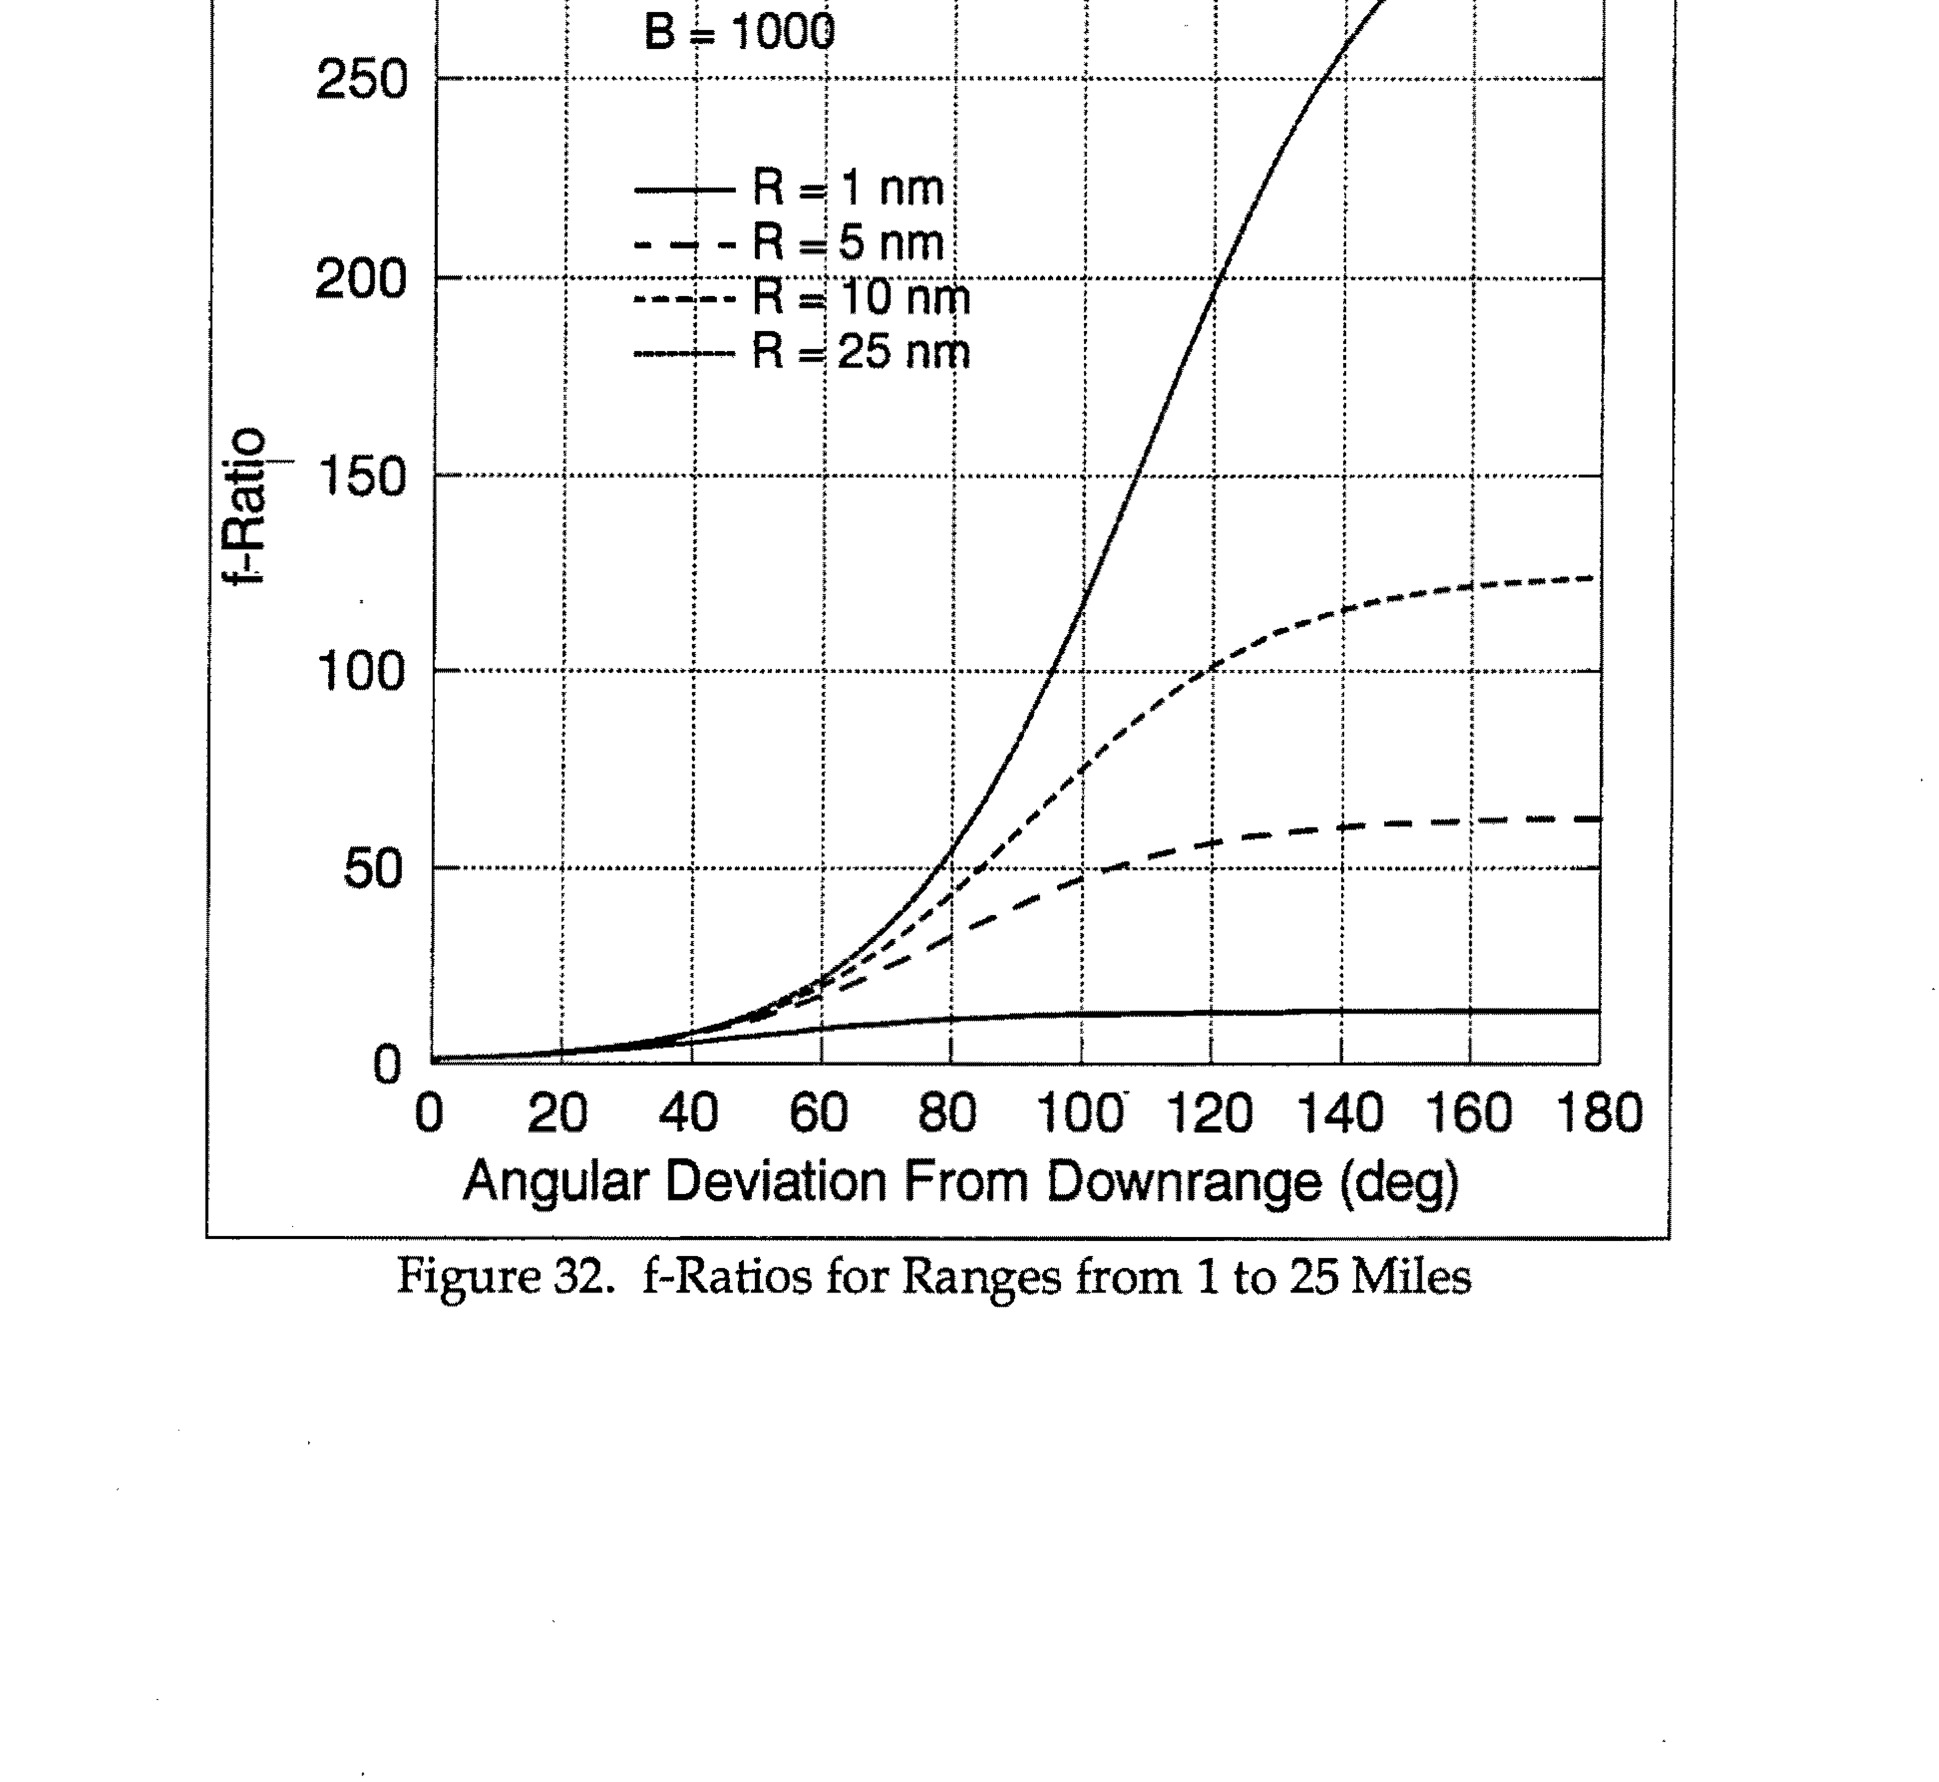
Figure 32. f-Ratios for Ranges from 1 to 25 Miles
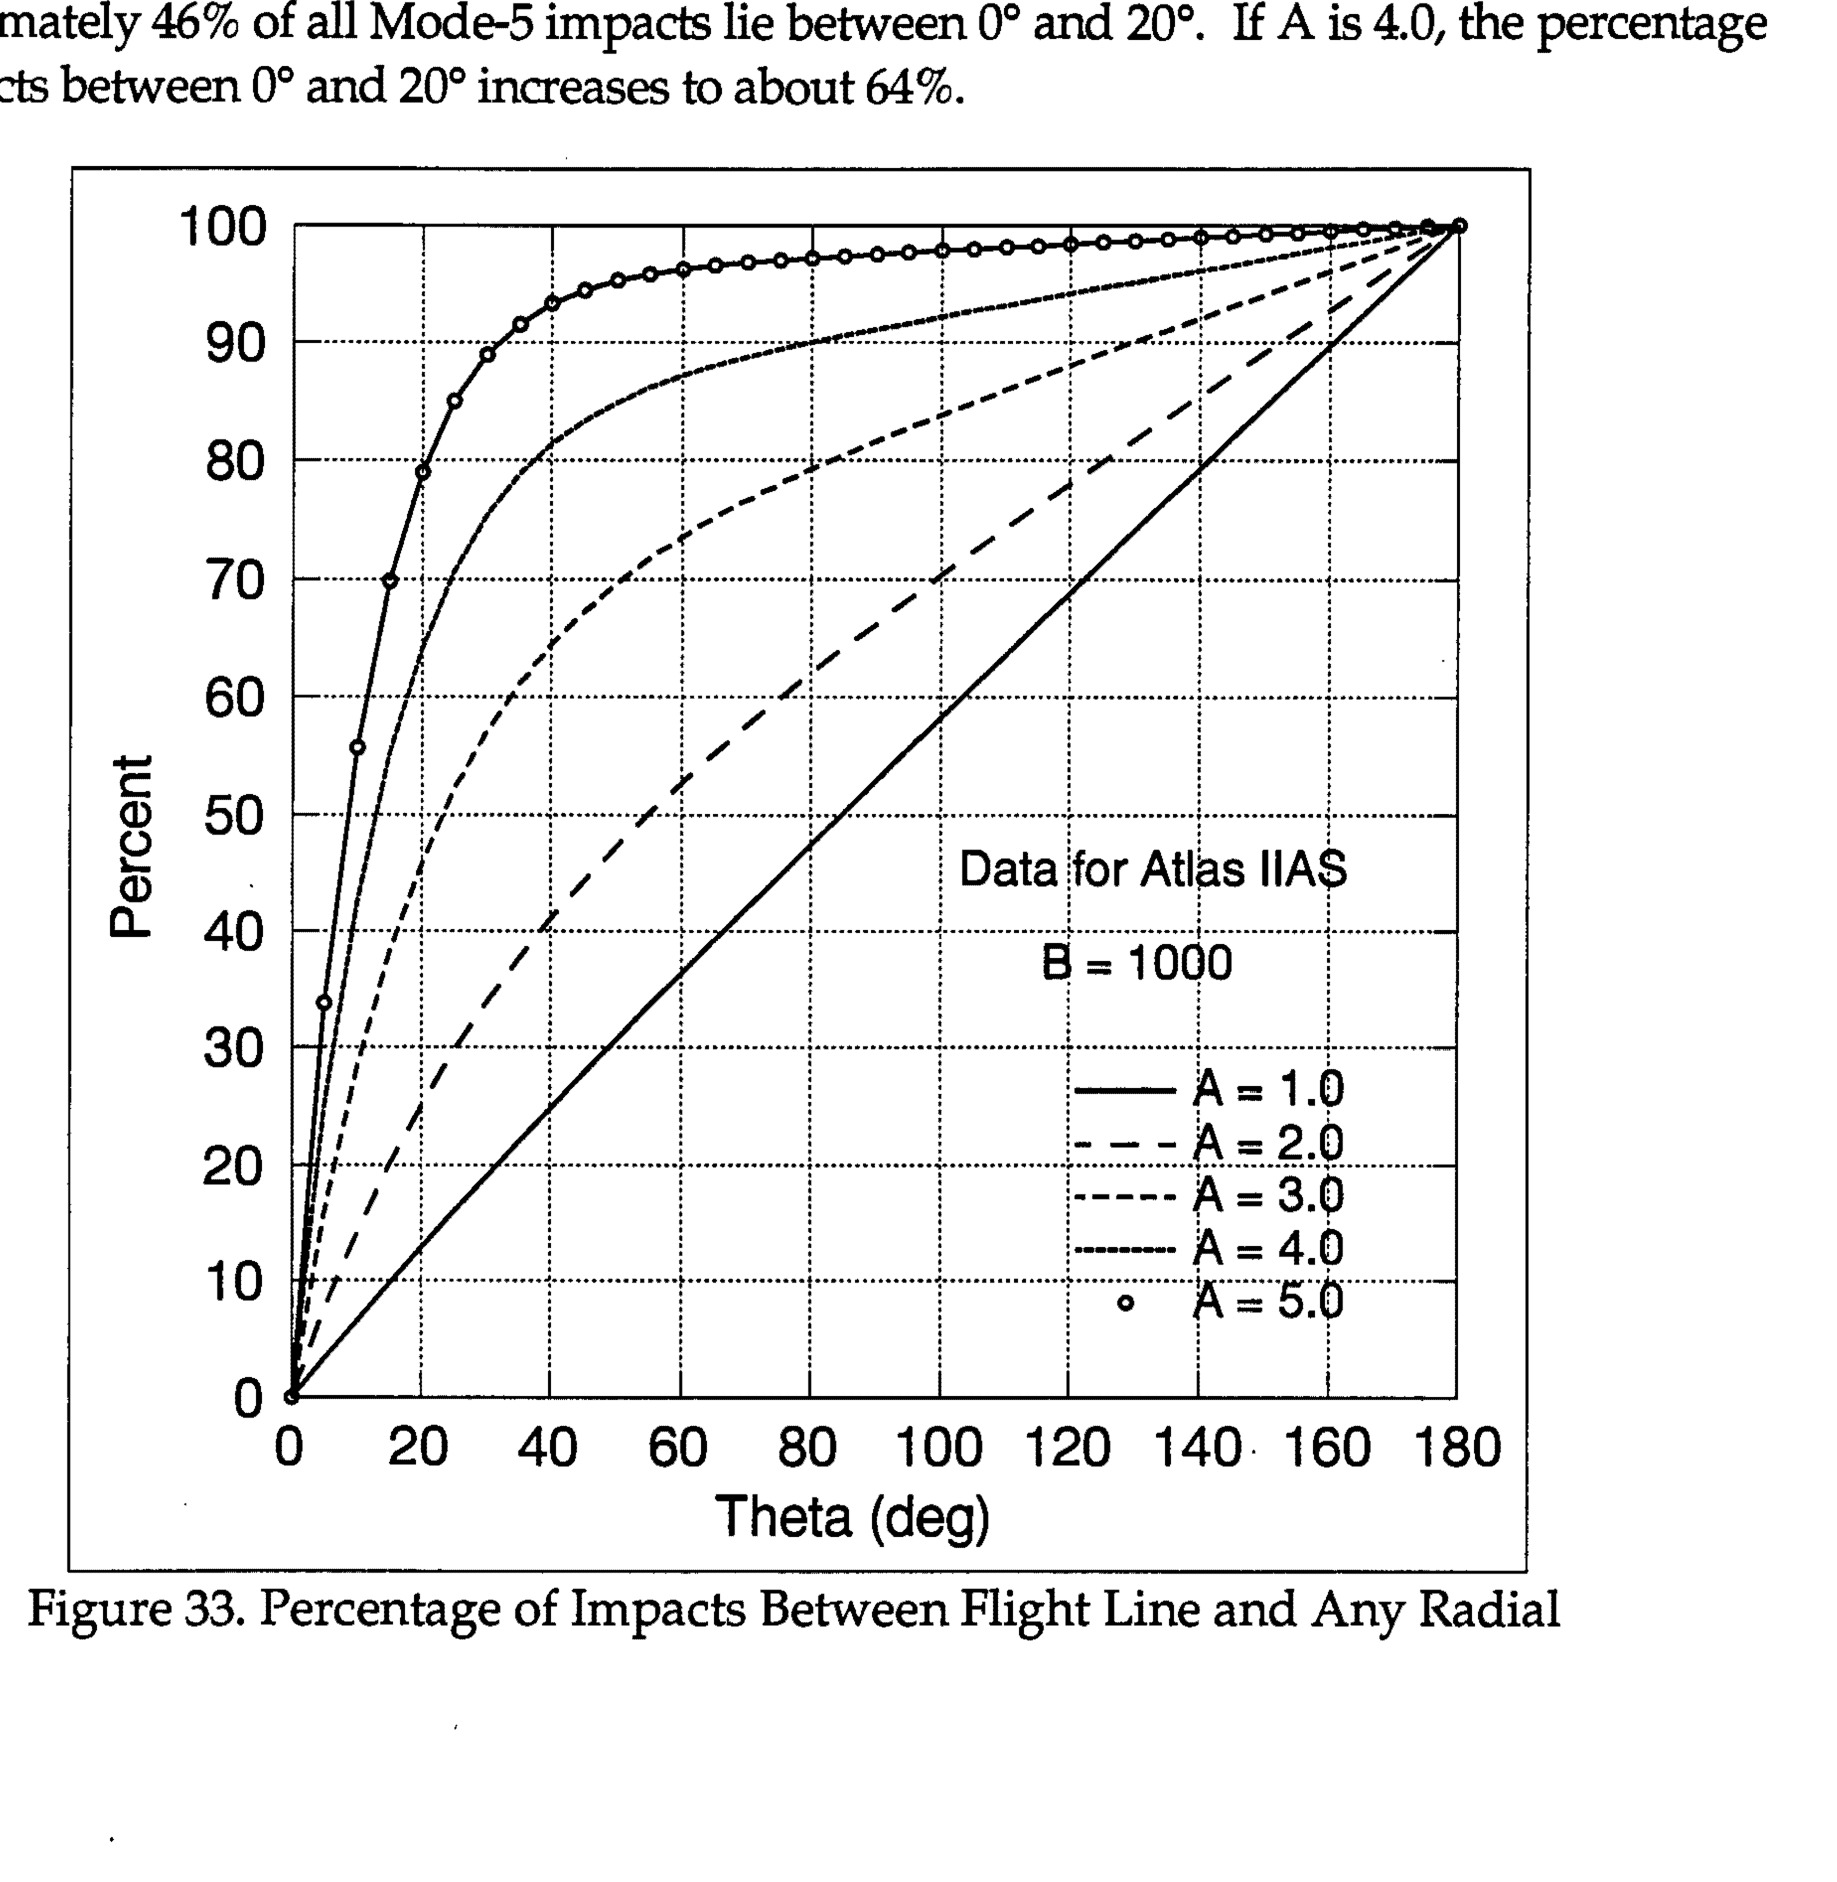
Figure 33. Percentage of Impacts Between Flight Line and Any Radial - Data for Atlas IIAS B = 1000, showing curves for A = 1.0, 2.0, 3.0, 4.0, 5.0
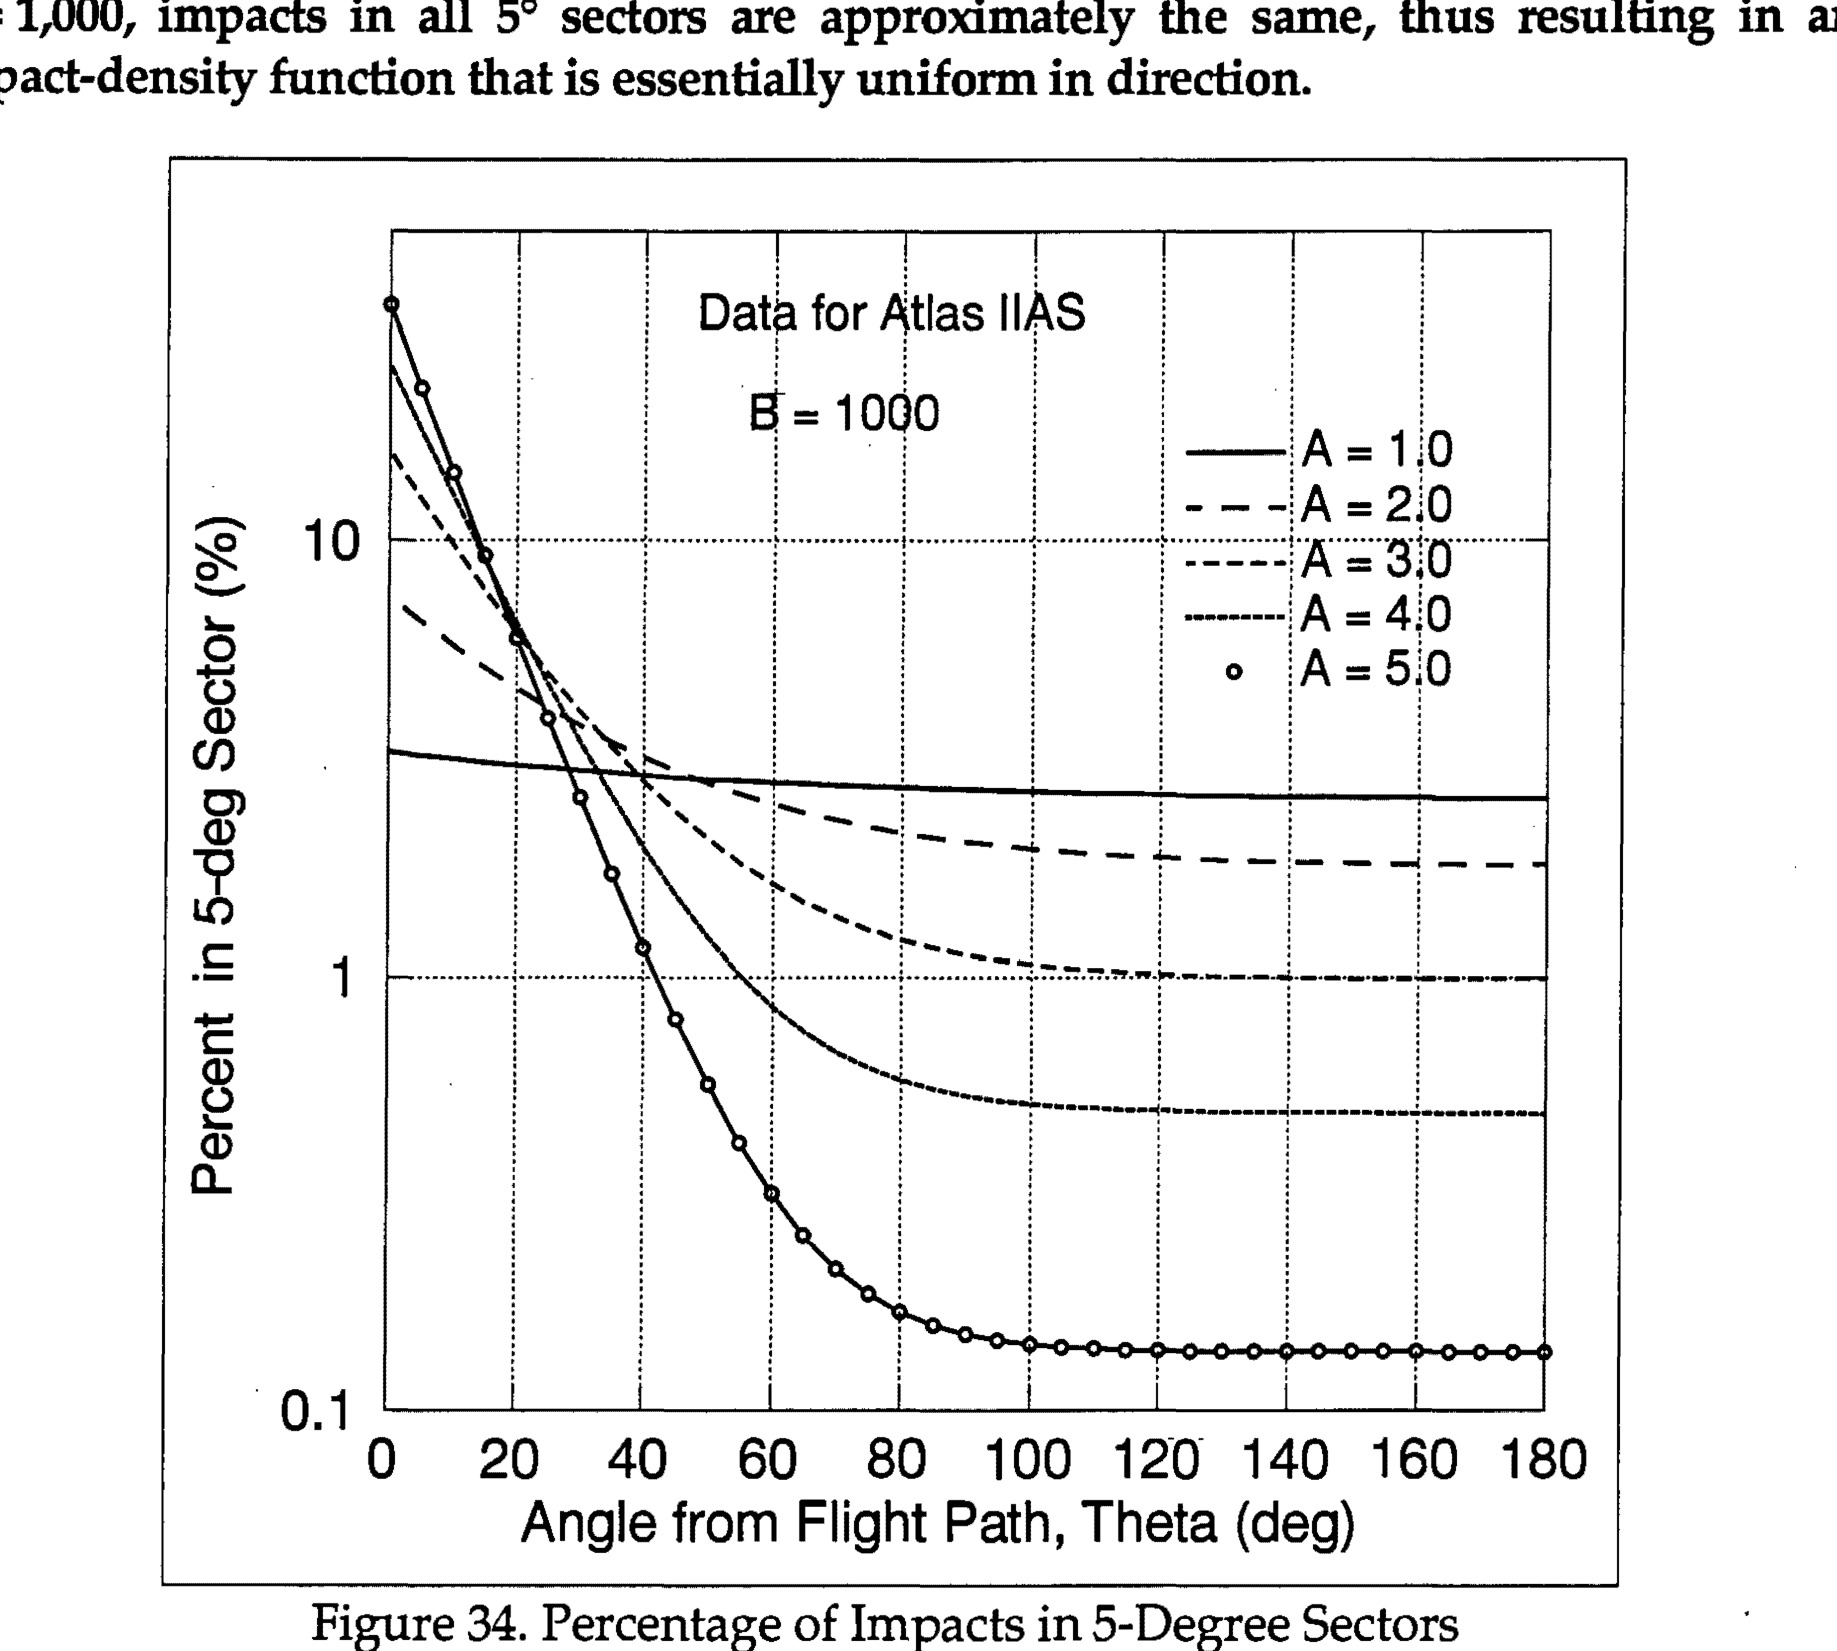
Data for Atlas IIAS, B = 1000, showing Percent in 5-deg Sector vs Angle from Flight Path, Theta (deg) for A values 1.0, 2.0, 3.0, 4.0, 5.0
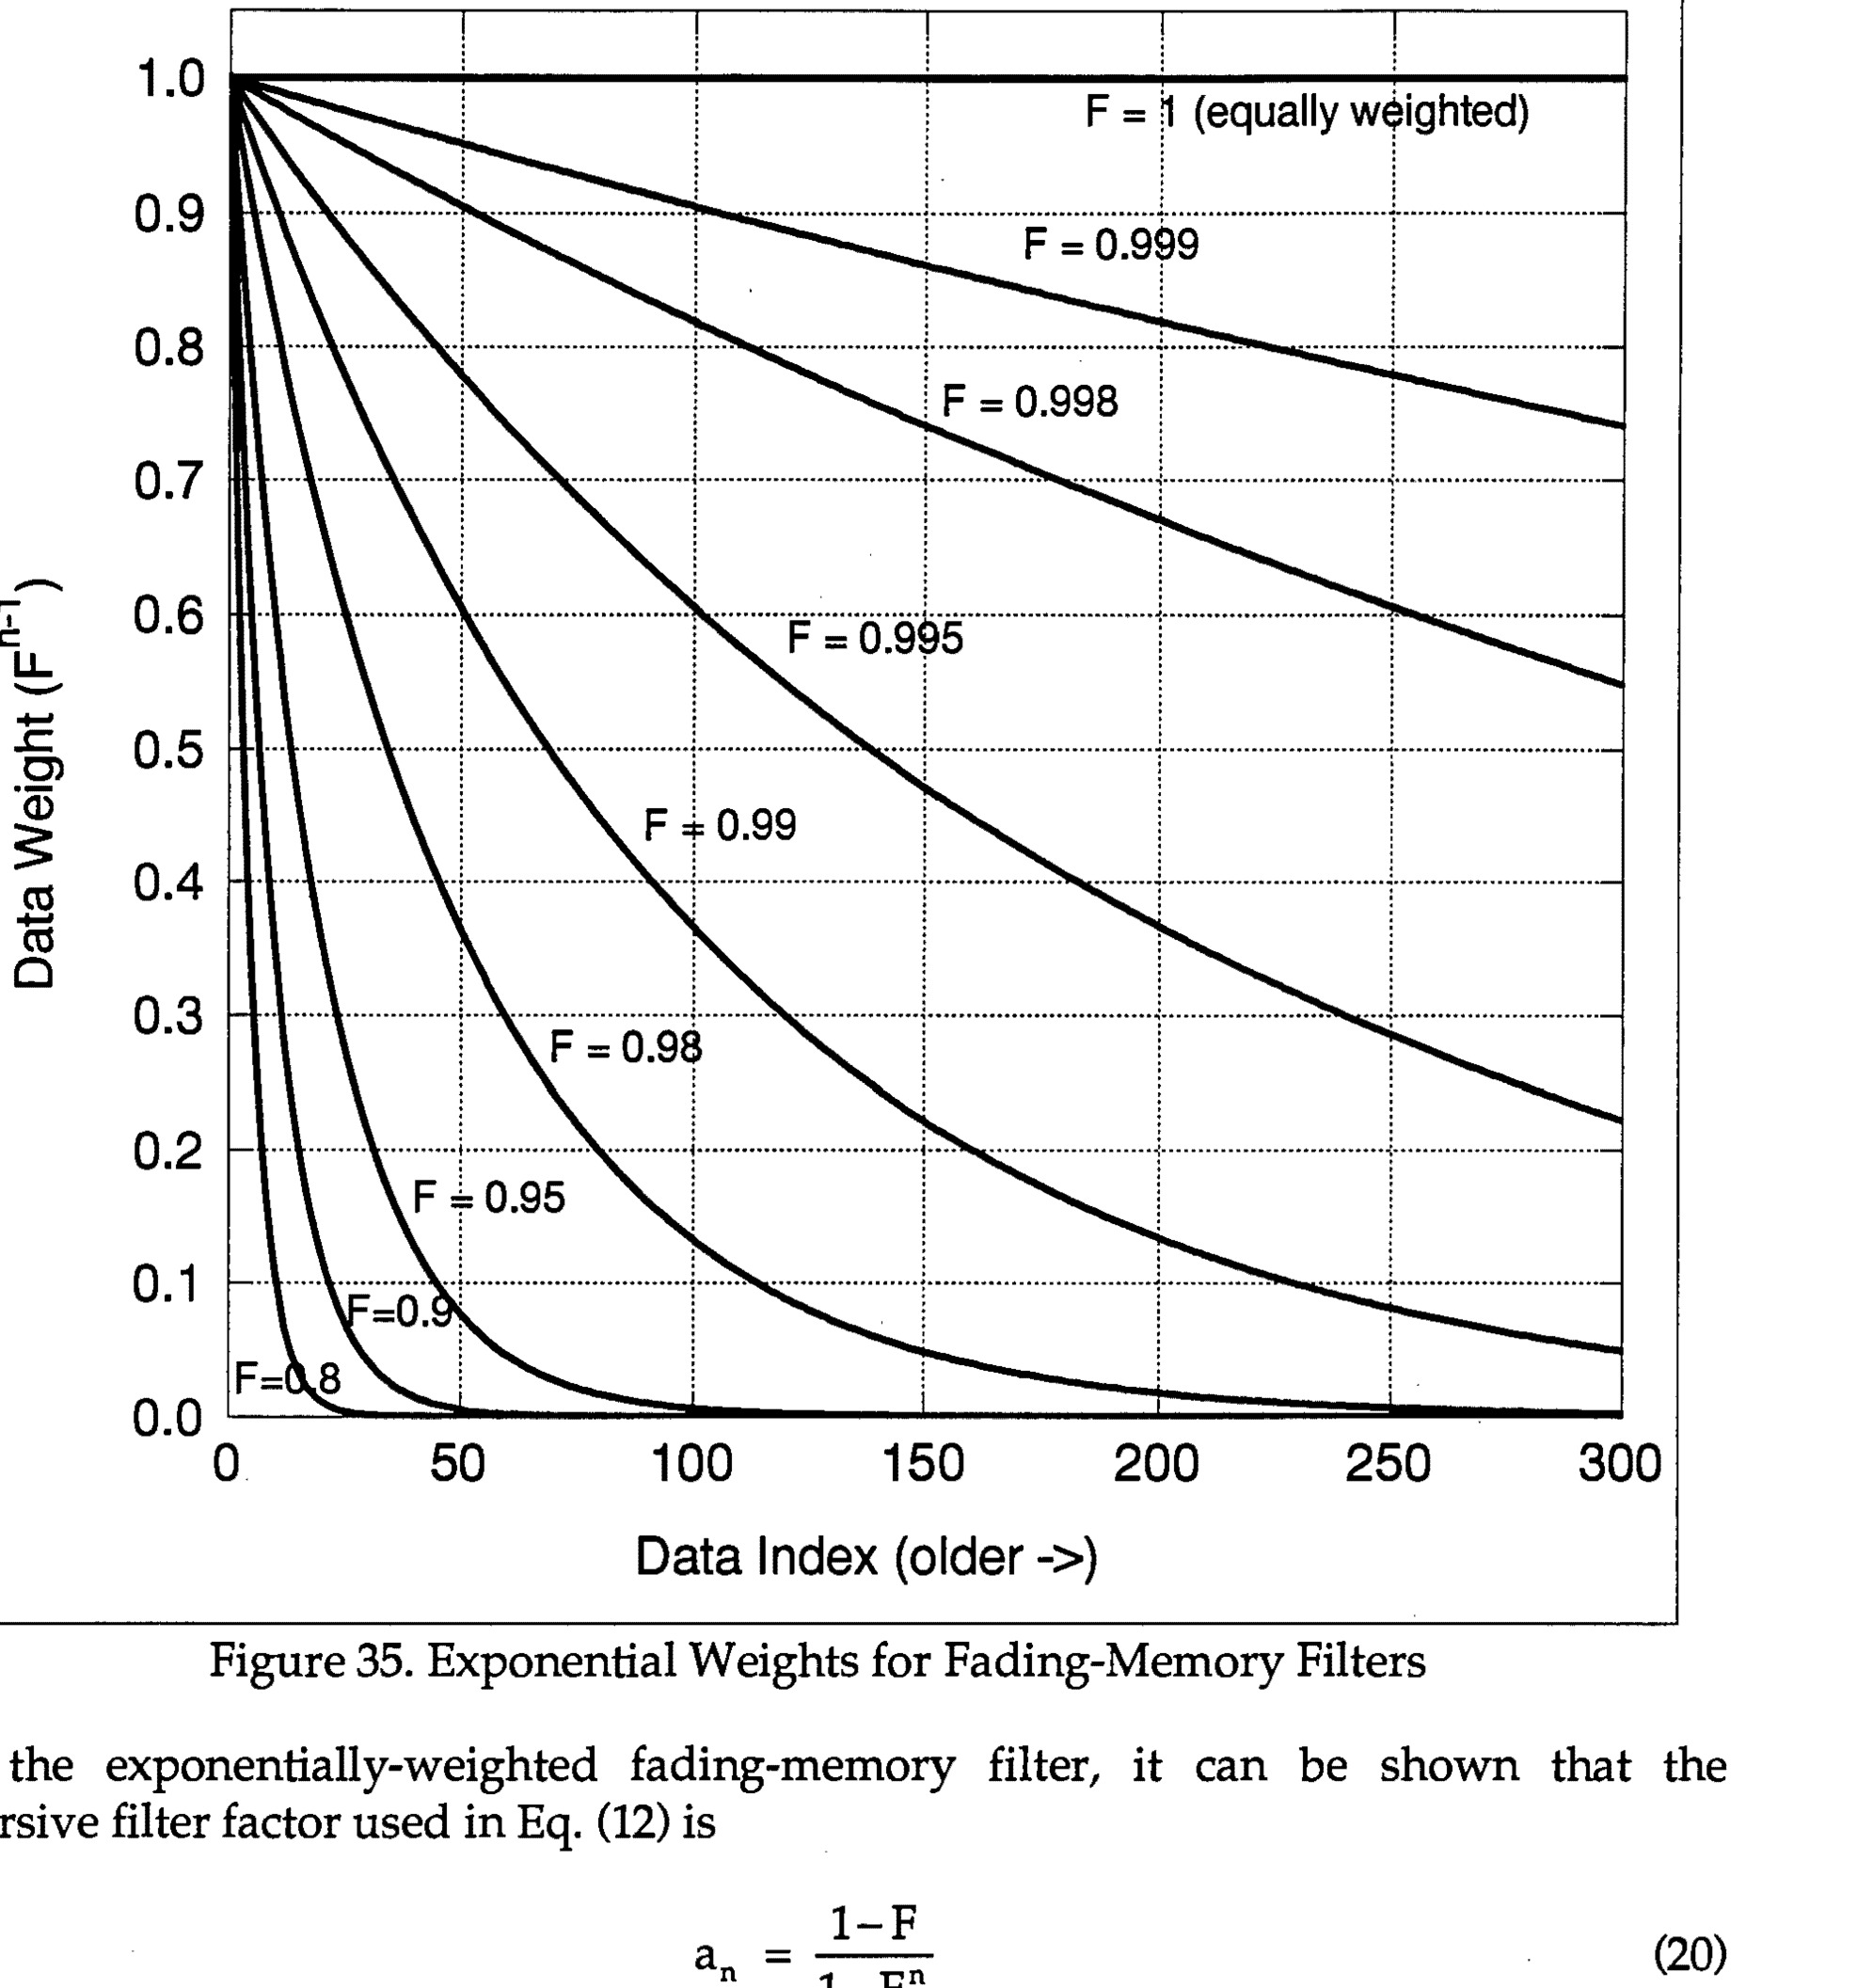
Figure 35. Exponential Weights for Fading-Memory Filters
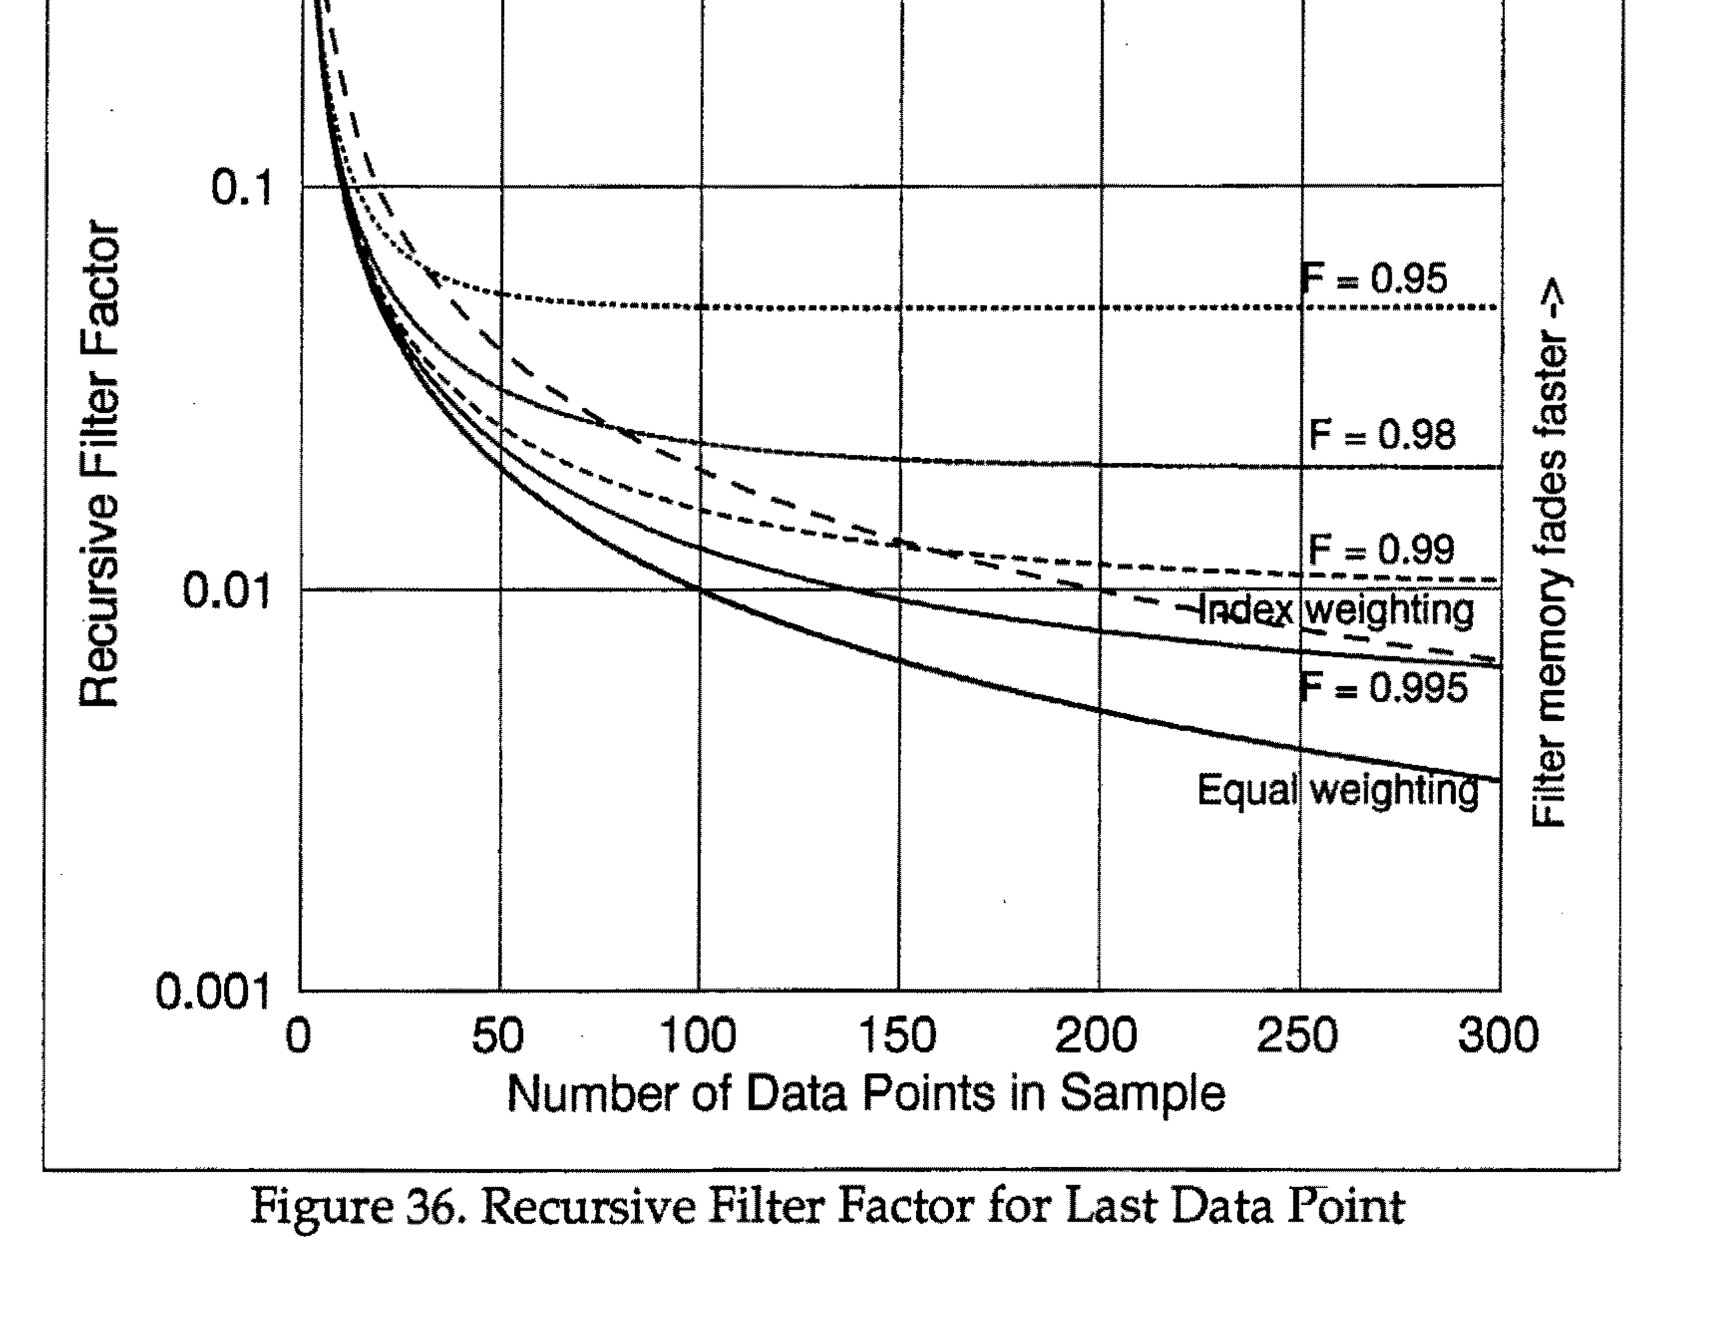
Figure 36. Recursive Filter Factor for Last Data Point
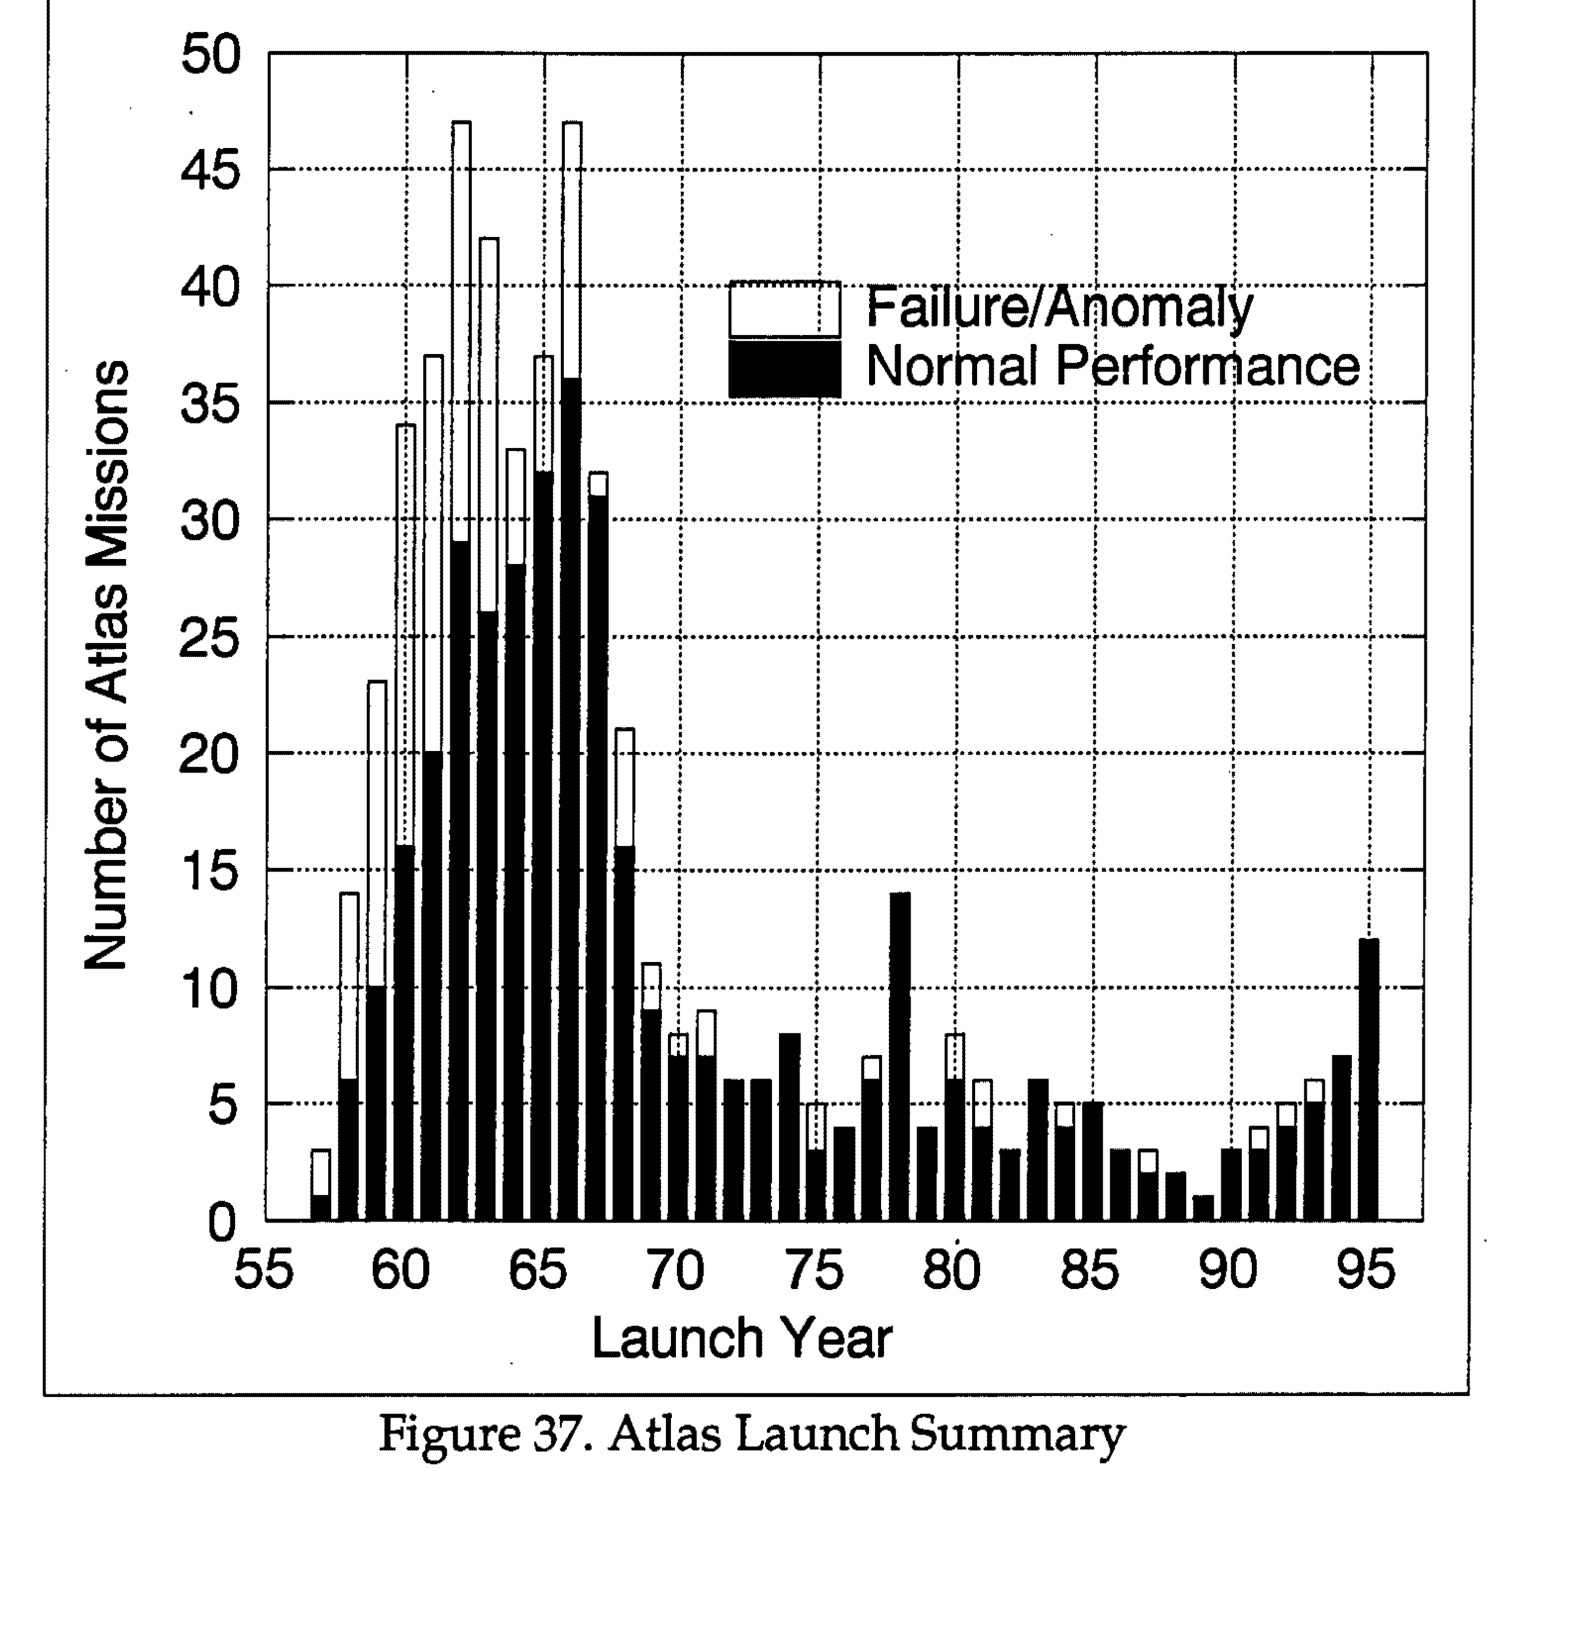
Figure 37. Atlas Launch Summary - Bar graph showing Number of Atlas Missions (0-50) vs Launch Year (55-95), with bars split between Failure/Anomaly (white) and Normal Performance (black)
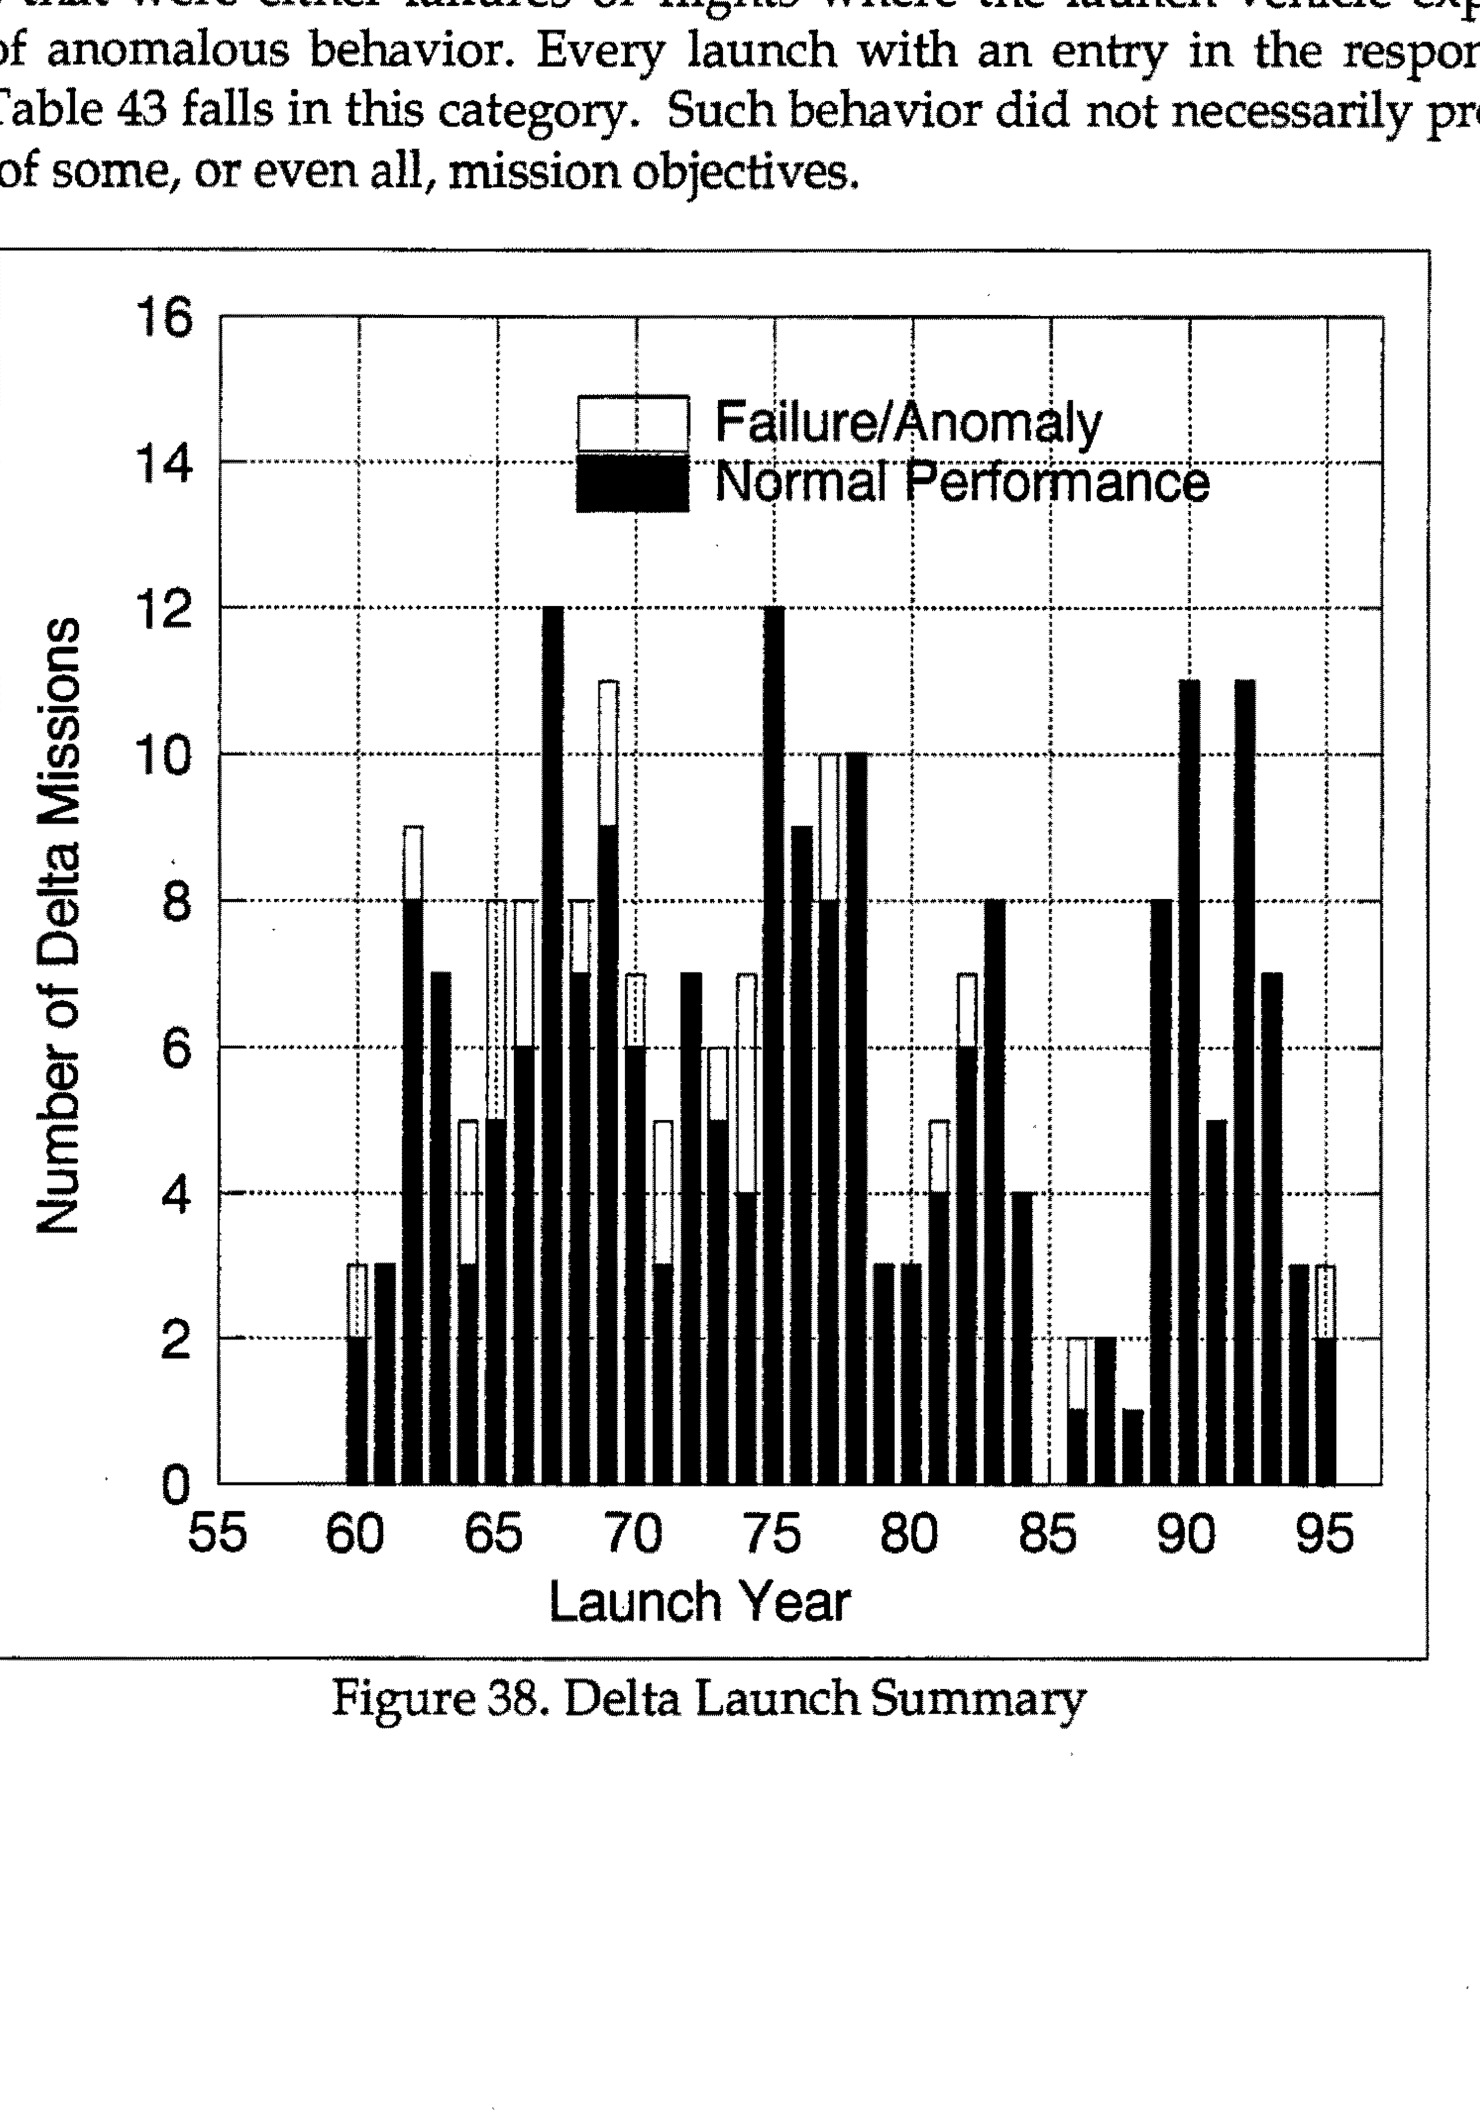
Figure 38. Delta Launch Summary - Bar graph showing Number of Delta Missions (0-16) vs Launch Year (55-95), with bars split between Failure/Anomaly (white) and Normal Performance (black)
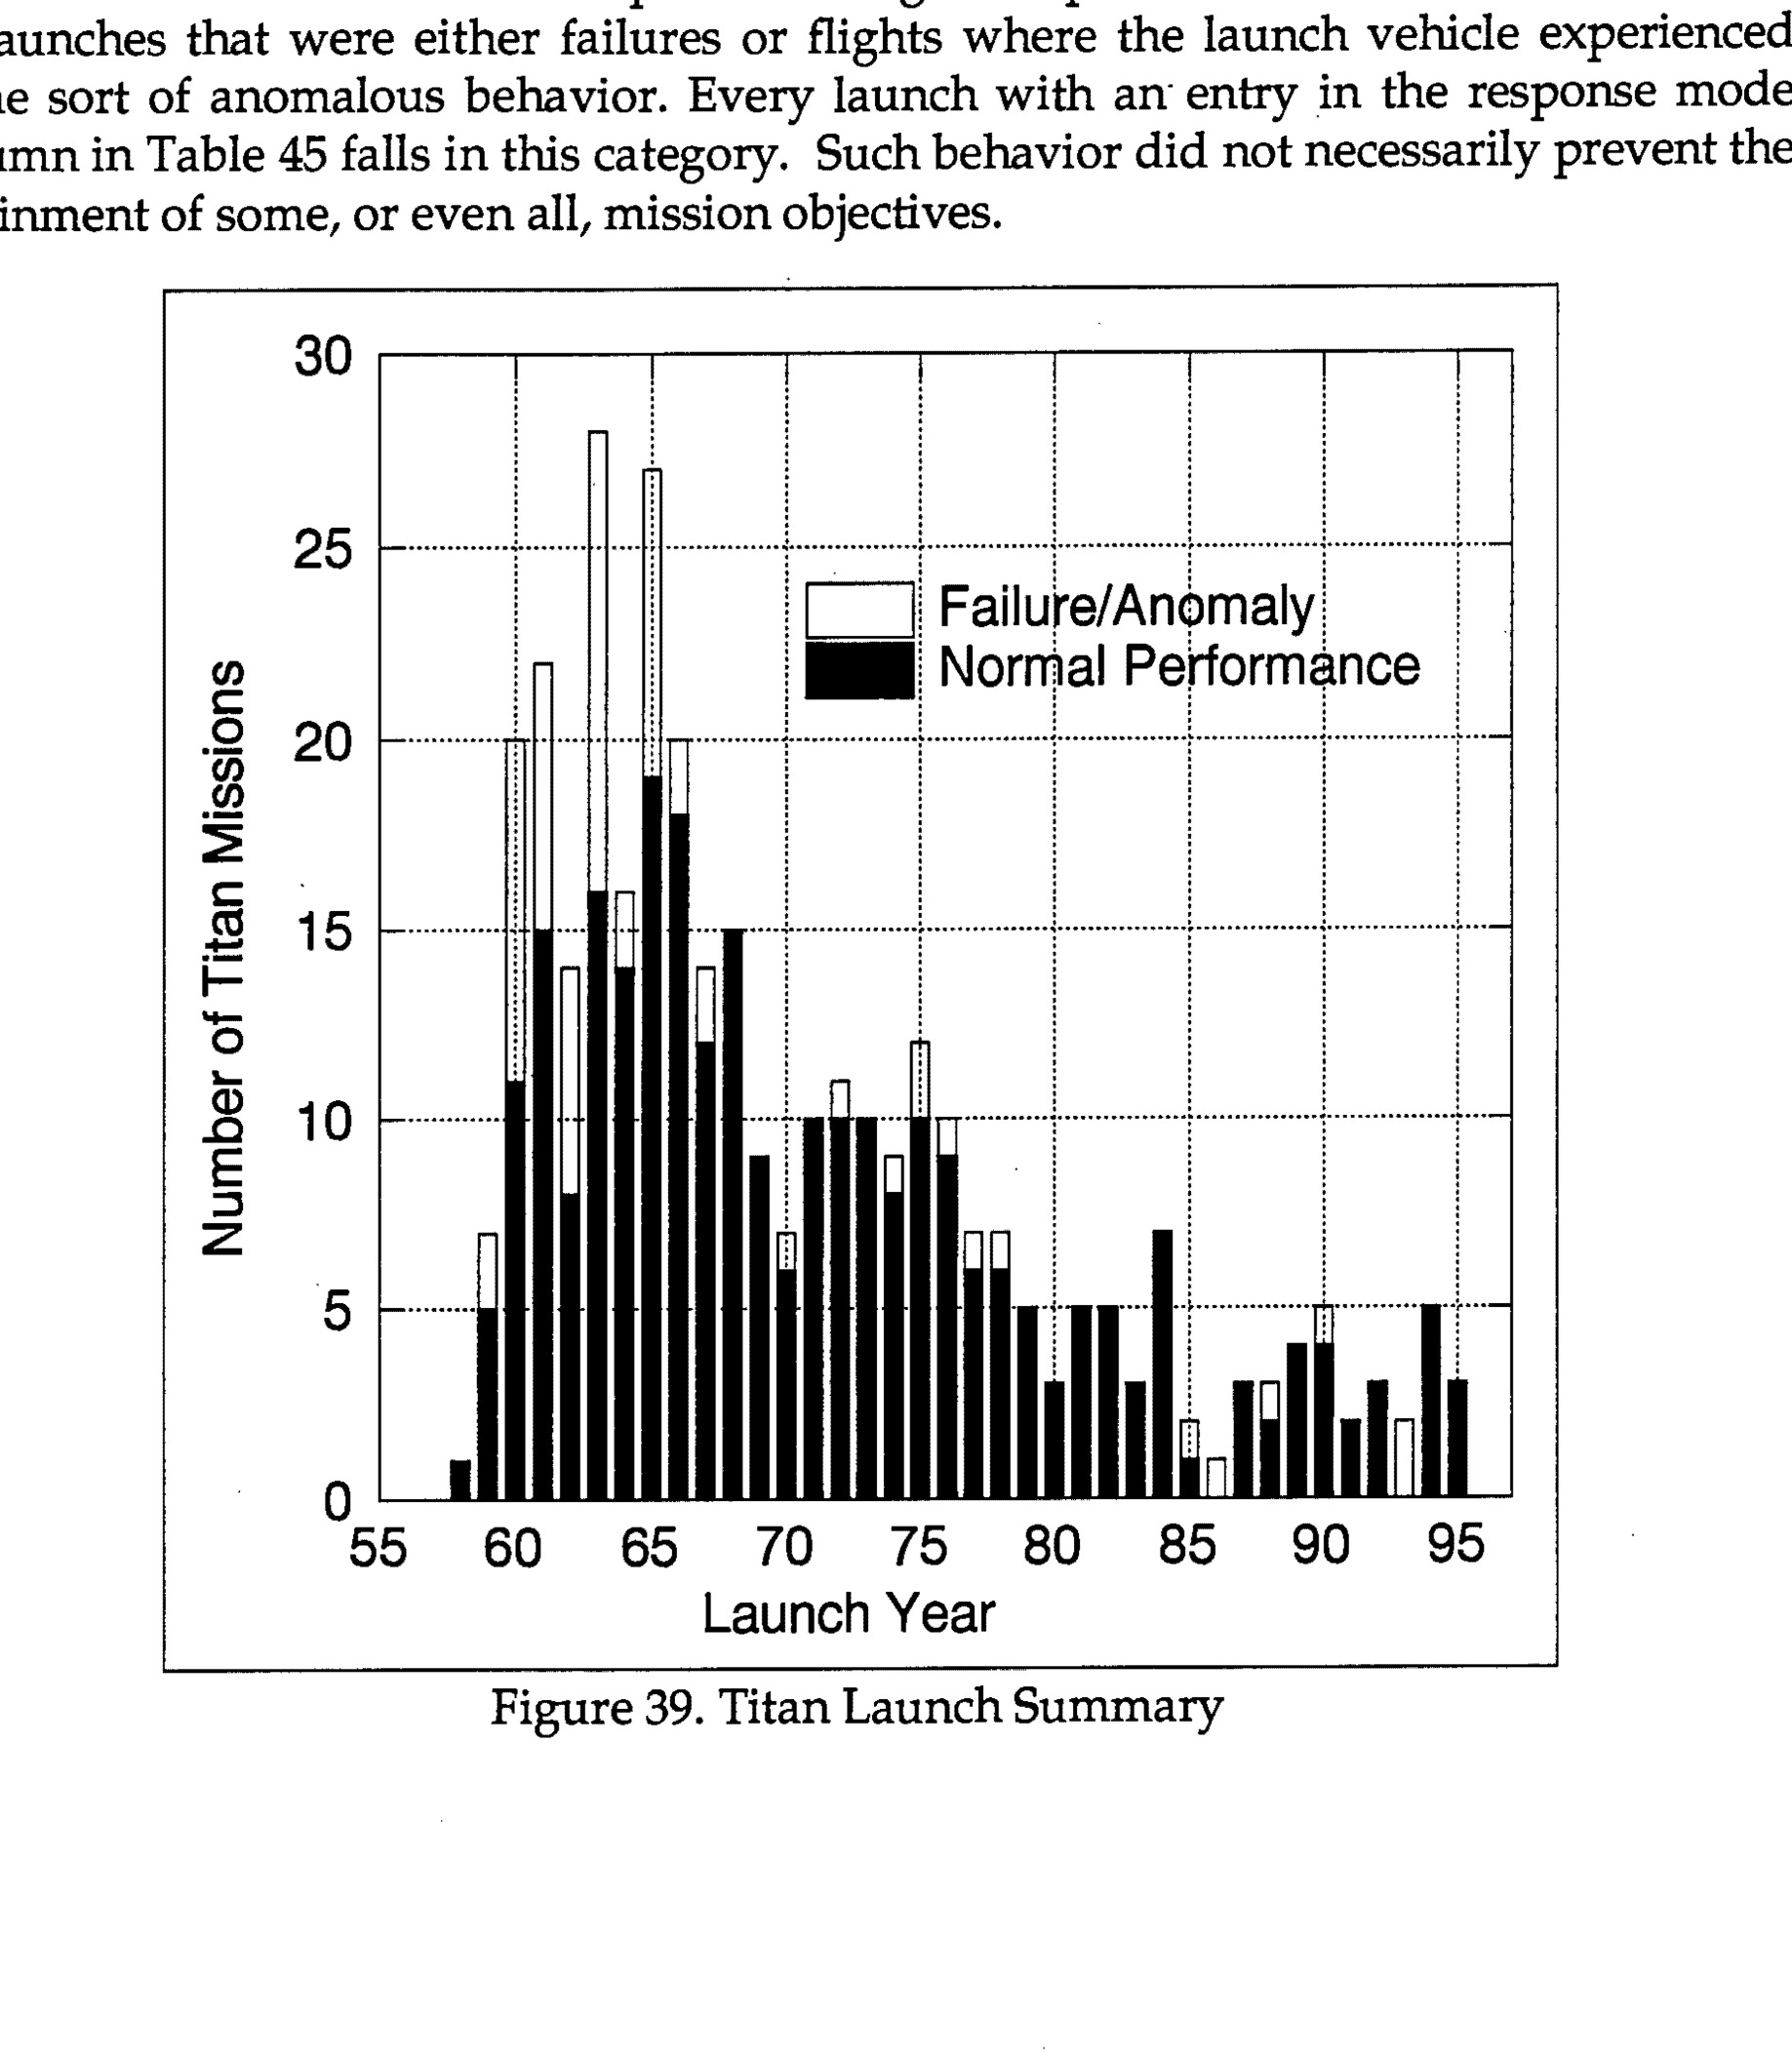
Figure 39. Titan Launch Summary - Bar graph showing Number of Titan Missions (y-axis, 0-30) vs Launch Year (x-axis, 55-95), with bars divided into Normal Performance (solid black) and Failure/Anomaly (clear white)
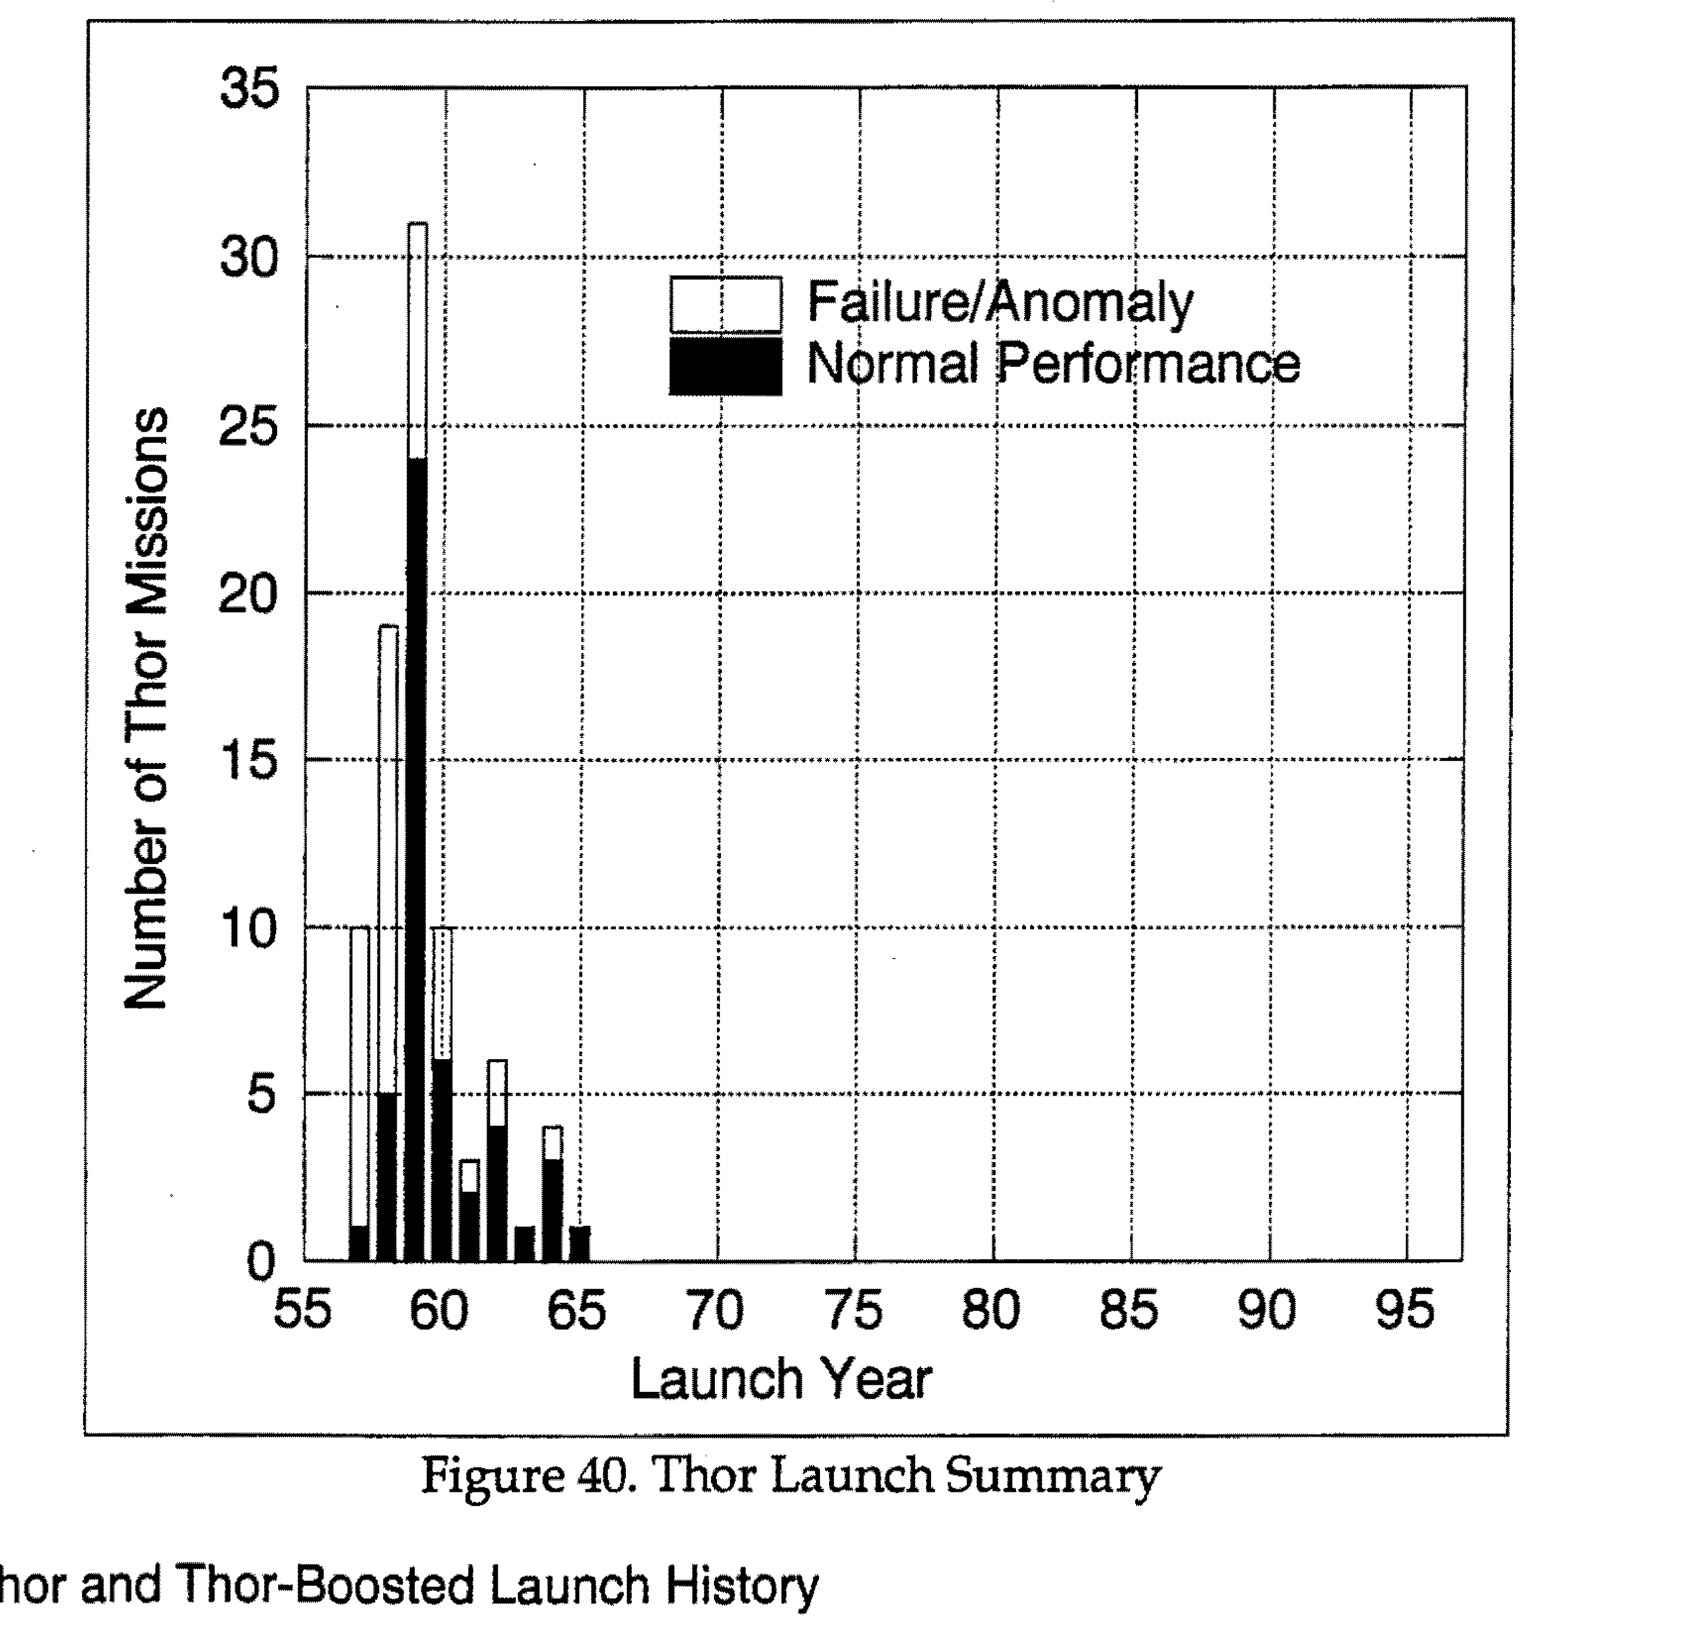
Figure 40. Thor Launch Summary - Bar graph showing Thor missions by launch year with normal performance and failure/anomaly breakdown
Pages (181)Machine-extracted text; expand to inspect pages and cite exact anchors. Verify against the PDF.View more ↓
RESEARCH TRIANGLE INSTITUTE
RESEARCH TRIANGLE INSTITUTE Contract No. FO4703-91-C-0112 RTI Report No. RTI/5180/77-43F September 10, 1996 Modeling Unlikely Space-Booster Failures in Risk Calculations Final Report Prepared for Department of the Air Force 45th Space Wing (AFSPC) Safety Office - 45 SW/SE Pa…
Contract No. FO4703-91-C-0112 Task No. 10/95-77, Subtask 2.0 RTI Report No. RTI/5180/77-43F September 10, 1996 Modeling Unlikely Space-Booster Failures in Risk Calculations Final Report Prepared by James A. Ward, Jr. Robert M. Montgomery of Research Triangle Institute Cent…
REPORT DOCUMENTATION PAGE
REPORT DOCUMENTATION PAGE Form Approved OMB No. 0704-0188 Public reporting burden for this collection of information is estimated to average 1 hour per response, including the time for reviewing instructions, searching existing data sources, gathering and maintaining the data n…
Abstract
Abstract Missile and space-vehicle performance histories contain many examples of failures that cause, or have the potential to cause, significant vehicle deviations from the intended flight line. In RTI's risk-analysis program, DAMP, such failures are referred to as Mode-5 fail…
Table of Contents 1. Introduction........................................................................................................................1 2. Examples Showing Need for Mode 5 ...............................................................................3 3. Un…
Appendix A. Failure Response Modes in Program DAMP..............................................79 Appendix B. Shaping-Constant Effects on Mode-5 Impact Distributions........................81 Appendix C. Filter Characteristics...................................................…
Table of Figures
Table of Figures Figure 1. Joust Impact Trace Showing a Mode-5 Failure Response...................................6 Figure 2. Atlas IIAS Risk Contours for Inner-Ear Injury with A = 3.0.............................11 Figure 3. Atlas IIAS Risk Contours for Inner-Ear Injury with…
Figure 31. LLV1 Simulation Results with Best-Fit Shaping Constants ............................. 71 Figure 32. f-Ratios for Ranges from 1 to 25 Miles ............................................................. 86 Figure 33. Percentage of Impacts Between Flight Line and Any Radi…
Table 19. Sample Impact Distribution for Atlas IIAS with No Breakup ..........................41 Table 20. Shaping Constants for Atlas IIAS........................................................................48 Table 21. Shaping Constants and Related Risks for Atlas IIAS......…
1. Introduction The debris from most launch vehicles that fail catastrophically tend to impact close to the intended flight line. Typical failures that produce such results are premature thrust termination, stage ignition failure, tank rupture or explosion, or rapid out-of-contr…
can cause impacts uprange or well away from the intended flight line, and (2) some vehicle failures cannot logically be classified as Response Modes 1, 2, 3, or 4. In keeping with the above, the Mode-5 impact-density function was developed with the characteristics listed below.…
relative probabilities of occurrence for all failure-response modes for these vehicles, LLV1, and other new launch systems. Although it may be reasonable to establish the relative probability of occurrence of a Mode-5 failure response by empirical means, the number of Mode-5 fai…
crossed over the flight line and continued toward the right destruct line. Shortly thereafter the missile apparently pitched up violently and the IIP began moving back toward the beach. The missile was destructed at about 45 seconds when the altitude was about 14,000 feet and the…
It is obvious from the response-mode definitions in Appendix A that none of the described vehicle failures can be considered as a Mode 1, 2, or 3 response, or a Mode-4 on-trajectory failure.* Except possibly for (2), it also seems apparent that none can be modeled as either a rap…
A good illustration of a Mode-5 failure response occurred during launch of Prospector (Joust) on the Eastern Range in June 1991. The Joust consists of a single-stage Castor IV-A solid-propellant rocket motor and a payload module. The "vehicle made a radical pitch-up maneuver due…
3. Understanding the Mode-5 Failure Response Unlike failure response Modes 3 and 4, response Mode 5 (and also Mode 2) is not a direct function of time from launch. For Modes 3 and 4, the mean point of impact (MPI) for each debris class is fixed, once the failure time is establis…
however, involve the quantity Ṙ which is expressed explicitly as a function of R and only implicitly as a function of time. Values of R from the nominal trajectory are differenced to compute Ṙ. The secondary Mode-5 impact-density function is circular normal in form and expressed…
acceleration of the vehicle body and a slow turn of the velocity vector, (4) erroneous accumulation of velocity bits by the guidance system. Many other Mode-5 responses are so convoluted that they defy description or categorization. 3.1 Effects of Mode-5 Shaping Constants The p…
Table 1. Effects of Mode-5 Shaping Constant A on Atlas IIA Risks B = 1,000 | Percent of Mode-5 | Casualty Expectancy (x 10⁻⁹) inside ILLs Constant A | IPs Uprange | Mode 5 | Total for all Modes 2.5 | 28.6 | 246 | 259.9 3.0 | 20.7 | 136 | 149.4 3.5 | 14.6 | 58.9 | 72.7 4.0 | 10.0…
Figure 2. Atlas IIAS Risk Contours for Inner-Ear Injury with A = 3.0
4. Methodology for Assessing Failure Probabilities A primary purpose of this study is to develop estimates of the relative probabilities of occurrence of a Mode-5 failure response for Atlas, Delta, Titan, and as a by-product, for other launch vehicles as well. Natural fallouts o…
c. Insertion of improper computer programs d. Support-personnel fatigue A third limitation of the parts-analysis approach discussed in Ref. [4] deals with the subjectivity and invalid assumptions often used to estimate piece/component reliabilities. Here Booz•Allen quotes from a…
they would be corrected.) However, experience has shown that design flaws do cause failures in operational launch systems, and will likely do so in the future." The major objection to the parts-analysis approach, hinted at above but not actually expressed, is that all such appro…
5. Computation of Failure Probabilities The test results for Atlas, Delta, and Titan in the tables of Appendix D have been used for three primary purposes: (1) To predict or estimate the overall probability that each vehicle will fail during the various phases of flight (see Ta…
Table 2. Predicted Failure Probabilities for Representative Configurations [TABLE] Vehicle | Flight Phase | Filter Technique: Equal Weight | Index Count | Expon. F=0.99 | Expon. F=0.98 | Expon F=0.97 | Sample Failures /Total Atlas | 0 | 0 | 0 | 0 | 0 | 0 | 0/7 Atlas | 0-1 | 0.02…
probabilities using index-count filtering are larger than those for exponential filtering. For Titan, the results are mixed, further suggesting that Titan reliability has not improved in recent years. For comparison purposes, the same filtering techniques have been applied to al…
hardware improvements that have taken place through the years. For samples approaching 100 or so, it seriously over-weights the old data and under-weights the more recent events. Although equal weighting does not seem suitable for this application, it could be appropriate in othe…
more and more as the sample size increases. For samples of 200, 500, and 1000, the weighting of the last 50 tests are, in each case, 43.7%, 19.0%, and 9.7% of the total weight. For samples of 100 or more, no matter how large, the index-count filter assigns 25% of the data weight…
Table 5. Filter Factor Influence on Weighting Percentages Vehicle | Filter | Last | Last 10 | Last 50 | Last | Last 100 | Pt. Ratio (sample) | Cons't | Point | Points | Points | Half * | Points | last: first Atlas | 0.96 | 4.01 | 33.6 | 87.2 | 96.0 | 98.5 | 560 (156) | 0.97 | 3.…
(2) to down-weight only slightly, or not at all, those failures that are random in nature, that can still occur in replacement components, or that occur only once in 100 or several hundred launches in components that have not yet failed. No matter what technique is employed, fil…
Figure 4. Filter Factor Results for Representative Configurations of Atlas In summary, it must be recognized that there is no "correct" value for F, and that it is even difficult to argue generally that one value of F is better than another. In RTI's view, values of F below 0.97…
Table 6. Failure Probabilities for Atlas, Delta, and Titan | | Predicted Failure Probability * | | | Flight Phase | Flight Phase | | Vehicle | 0 - 1 | 0 - 2 | | Atlas | 0.022 | 0.031 | | Delta | 0.010 | 0.013 | | Titan | 0.040 | 0.064 | * Exponential filter with F = 0.98 For D…
from the Western Range were not included since available performance records were incomplete. The results for the four vehicles are combined in Table 11. Table 12 gives last-occurrence dates by response mode for each launch vehicle. Table 7. Number of Atlas Failures - All Config…
Table 11. Number of Failures for All Vehicles (1186 Flights) Flight Phase | 1 | 2 | 3 | 4 | 5 | 'NA' | 3 & 4 Tumble 0 | 0 | 0 | 0 | 3 | 0 | 0 | 1 0 - 1 | 13 | 4 | 3 | 68 | 15 | 11 | 19 0 - 2 | 13 | 4 | 3 | 129 | 27 | 29 | 33 0 - 3 | 13 | 4 | 3 | 161 | 28 | 38 | 40 0 - 4 | 13 | 4…
Table 13. Percentage Weighting for Sample of 1186 Launches Filter Constant | Last Point | Last 100 Points | Last 200 Points | Last 300 Points | Last 500 Points | Point Ratio Last:First 0.999 | 0.14 | 13.7 | 26.1 | 37.3 | 56.7 | 3.3 0.996 | 0.40 | 33.3 | 55.6 | 70.6 | 87.3 | 1.2…
that 0.993 is superior to 0.992 or 0.994, or even values outside this interval, a value of 0.993 was chosen. This section has thus far described a rationale for selecting a filtering process and filter constant to estimate percentages of occurrence of failure-response modes for…
Table 16. Recommended Response-Mode Percentages for Flight Phases 0 - 1 Response Mode | Mature Launch Systems (F = 0.993) | New Solid Systems (F = 0.996) | New Liquid Systems (F = 0.999) 1 | 0.5 | 3.4 | 10.7 2 | 7.4 | 6.6 | 4.3 3 | 0.1 | 0.6 | 2.4 4 | 81.9 | 74.5 | 67.0 5 | 10.1…
5.3 Relative Probability of Tumble for Response-Modes 3 and 4 Exponential filters with values of F from 0.98 to 0.999 have been used to estimate the percentage of Mode-3 and Mode-4 responses that terminate with a thrusting tumble. Results are given in Table 18 for flight phases…
6. Shaping Constants Through Simulation Since adequate test data are not available to establish the Mode-5 shaping constants empirically, other methods are needed for this purpose. It will be recalled that, after vehicle pitchover, any malfunction with the potential to cause a s…
for a suitably large sample so the distribution of resulting impact points will, for all practical purposes, represent all possible impact points, irrespective of the actual nature of the failure. Depending on vehicle breakup characteristics and failure time, a vehicle that expe…
cumulative angle turned versus time. Since the slope of the curve (i.e., the turning rate) is greatest when the thrust (and thus airframe) is directed at right angles to the velocity vector, the average angular acceleration during the first 90° of rotation was obtained from the e…
density function. Since this could not be done in general, impacts from only the two types of malfunction turns were considered. Several factors affect the results of the simulations: a. Weighting of turn data: Both random-attitude and slow-turn simulations were made for Atlas I…
response. Referring to Eq. (3), the right-hand member must be multiplied by the probability pc of a Mode-5 response to obtain absolute probabilities. Except for Tb itself (and to a slight degree, shaping constants A and B), the quantities in the equation do not depend on Tb. Thus…
Figure 5. Combined Random-Attitude and Slow-Turn Results
6.2 Shaping Constants for Atlas IIAS 6.2.1 Optimum Mode-5 Shaping Constants Since the dynamic pressures that can cause the Atlas IIAS to break up were not available, random-attitude failures were simulated for a no-breakup case and for three breakup qα's: 20,000 deg-lb/ft², 10,…
In this region, breakup occurs at or shortly after vehicle failure. Beyond 170 seconds, the dynamic pressure between failure and 280 seconds stays sufficiently low so that the vehicle remains intact. The dramatic differences in impact distributions that can result at certain tim…
Atlas IIAS Impacts Random-Attitude Failures at t30 sec Thrust to 280 sec No Breakup Figure 7. Atlas IIAS Impacts with No Breakup 9/10/96 39 RTI
Figure 8. Atlas IIAS Impacts with Breakup Atlas IIAS Impacts Random-Attitude Failures at 130 sec. Thrust to 230 sec. Breakup q-alpha = 5000 deg-lb/ft²
Table 19. Sample Impact Distribution for Atlas IIAS with No Breakup
Table 19. Sample Impact Distribution for Atlas IIAS with No Breakup Failure Time (sec) Ang. | 15 | 35 | 55 | 75 | 95 | 115 | 135 | 155 | 175 | 195 | 215 | 235 | 255 | 275 | All | % 0 | 255 | 300 | 411 | 487 | 608 | 835 | 1107 | 1843 | 3333 | 4092 | 5386 | 7906 | 10000 | 10000 |…
In Figure 9, the percentages of impacts in 5° sectors from 0° to 180° have been plotted for Atlas IIAS random-attitude turns out to 280 seconds. (It should be remembered that random-attitude turns are representative of combined random-attitude and slow turns.) For B = 1000, theor…
the other end. It is possible, however, to obtain fairly close agreement over sectors* from ±80° to ±180°, as seen in Figure 9. Since for Atlas IIAS there are few, if any, significant population centers in the launch area outside these sectors (i.e., within ±80° of the flight lin…
Figure 12. Atlas IIAS Simulation Results with B = 500,000
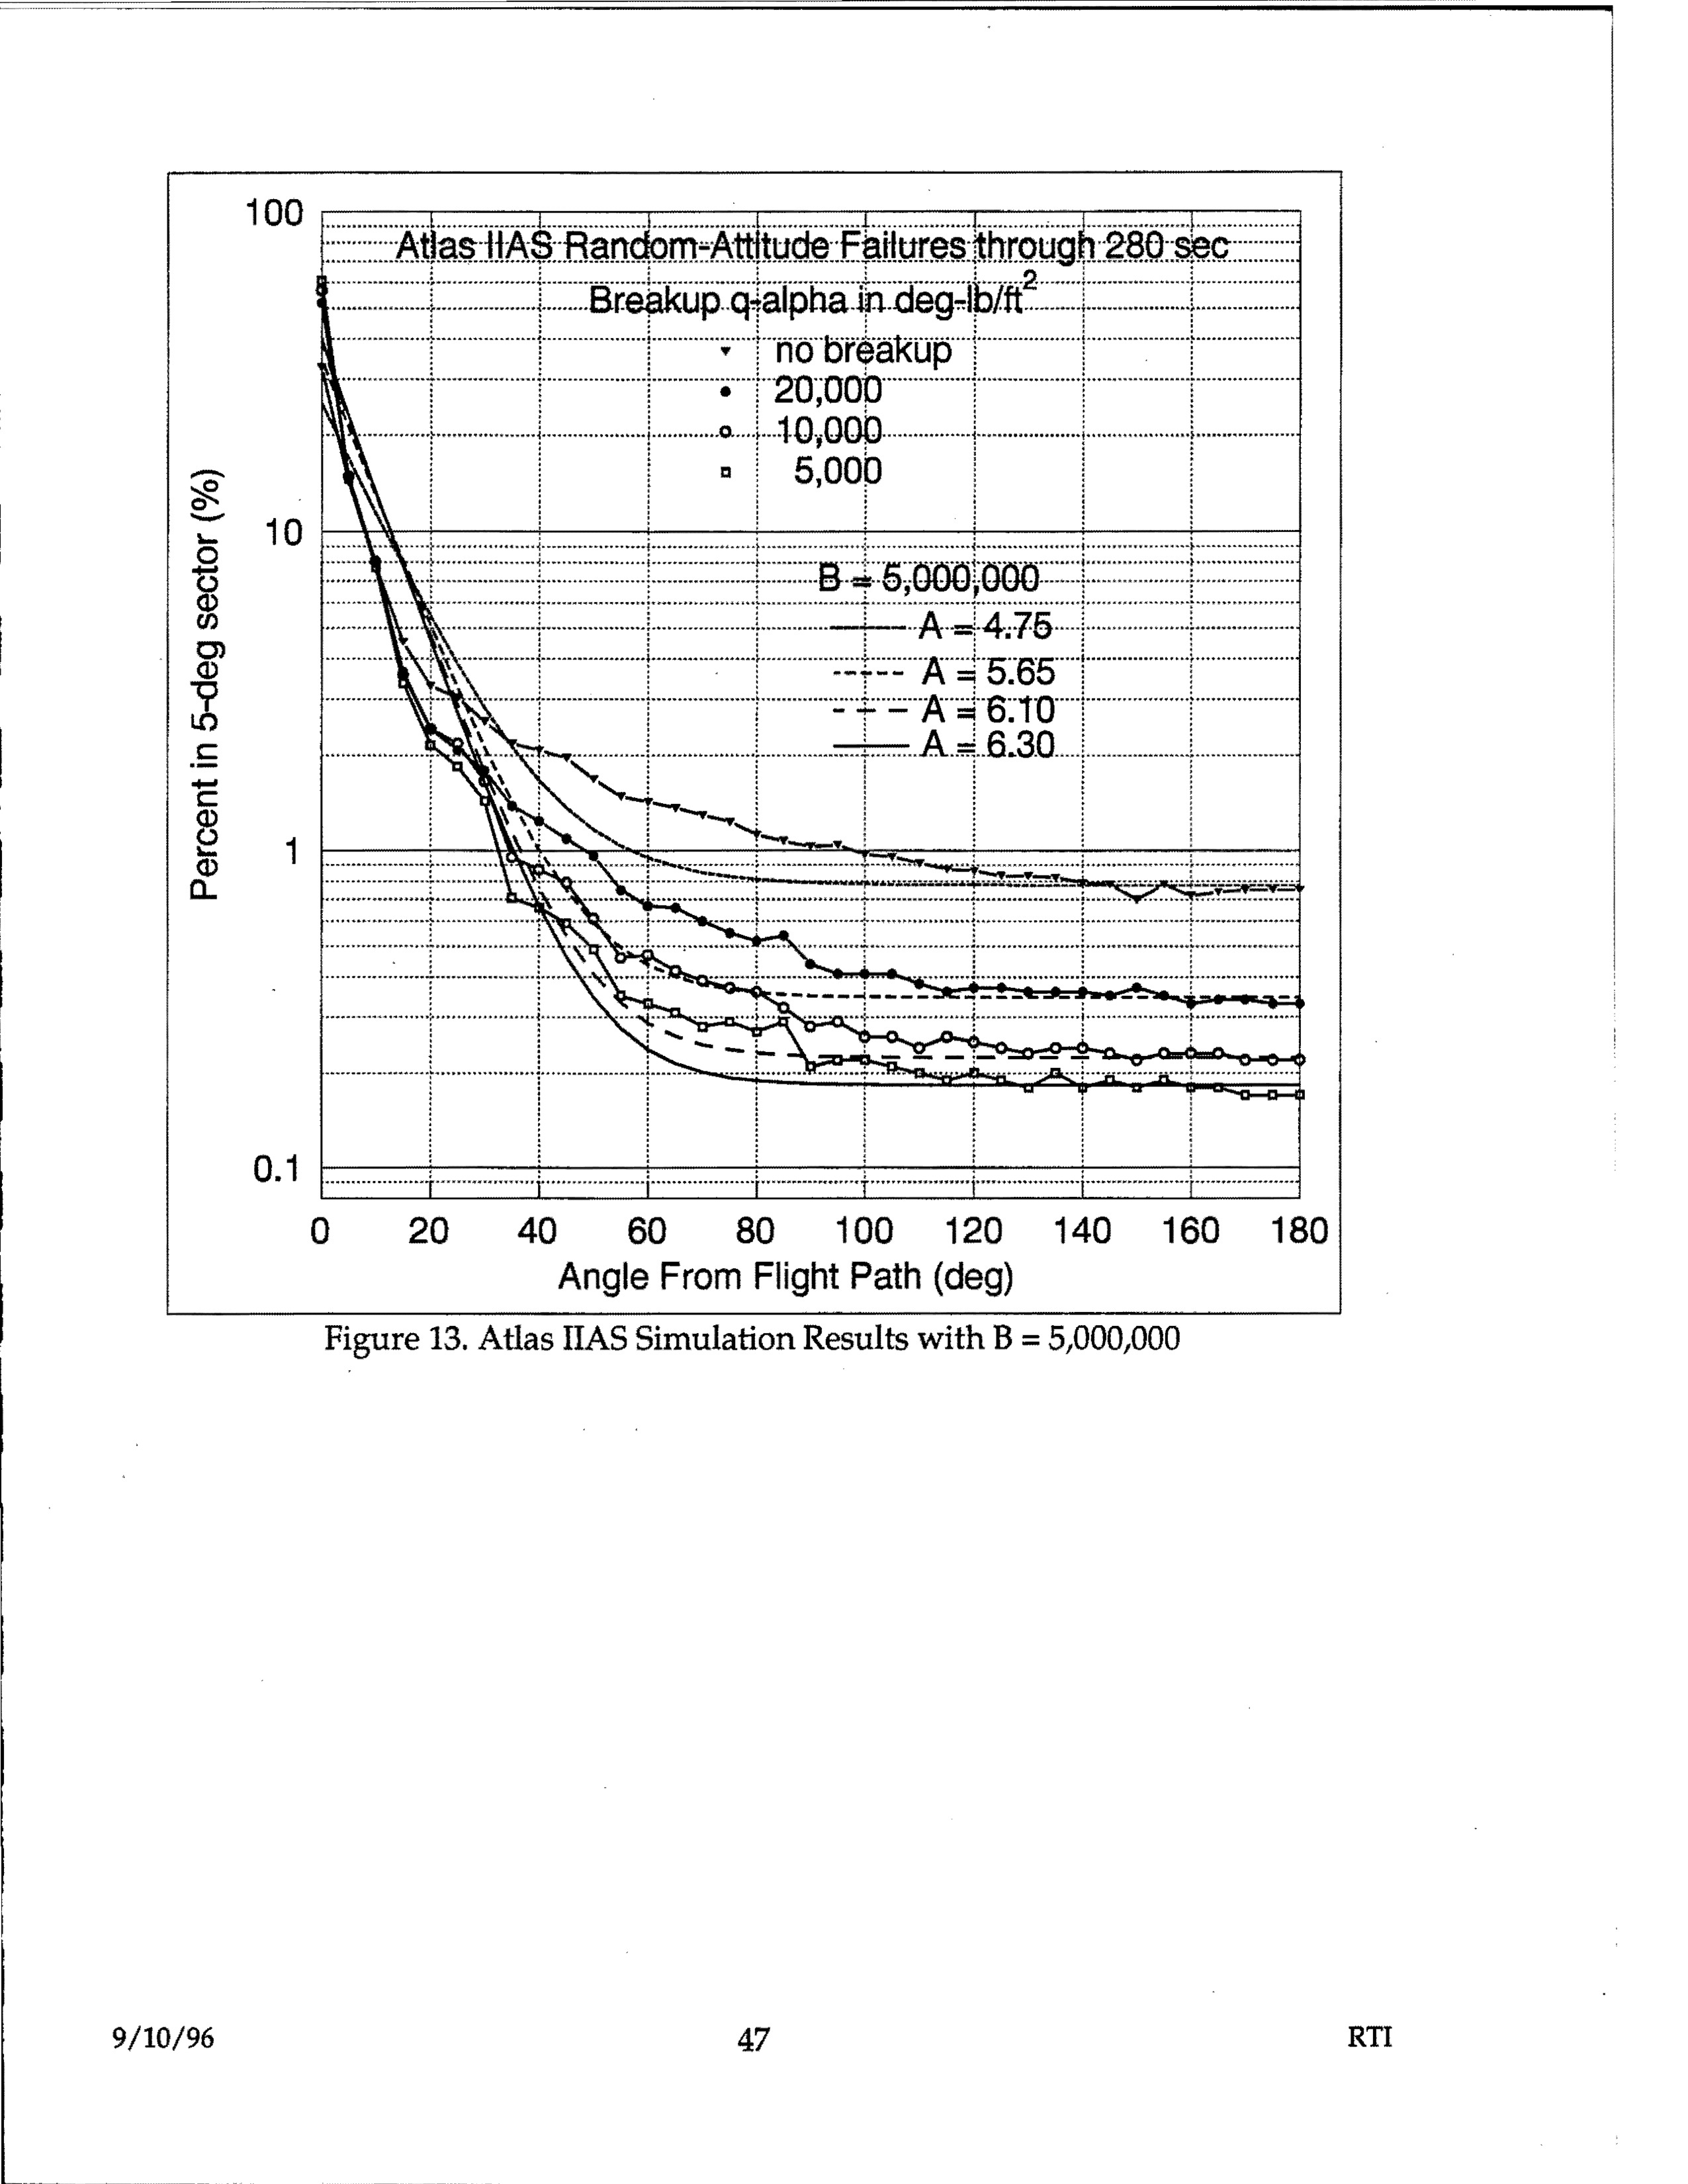
Figure 13. Atlas IIAS Simulation Results with B = 5,000,000
The five values of B and the corresponding best-fit values of A used to compute the Mode-5 distributions shown in Figure 9 through Figure 13 are tabulated in Table 20. It is apparent that the value of A is dependent on both qα and B. In general, if a larger value of B is selected…
Because of the uncertainties in breakup conditions, the values of A for each B in Table 20 have been plotted against qα in Figure 14. By reading from the plots, a value of A for the five values of B can be obtained for any breakup qα deemed appropriate between 5,000 and 20,000 de…
F = 0.98. The conditional probability of a Mode-5 response was assumed to be 0.08 (from the last line of Table 15), so the absolute probability was 0.031 × 0.08 = 0.0025. For the remaining cases in Table 21, the same assumptions were made for the total failure probability and for…
the differences in calculated Mode-5 risks for the different values of B would surely have been less. Further understanding of why small differences in Ec exist can be gained by plotting values of the Mode-5 density function computed from Eq. (3) This has been done in Figure 15…
cases the agreement gradually deteriorated for angles below ±100° while, in other cases, agreement was remarkably good to ±40°. Below this, agreement was generally poor except in a region between ±3° and ±6° where the theoretical and simulated curves crossed. As pointed out prev…
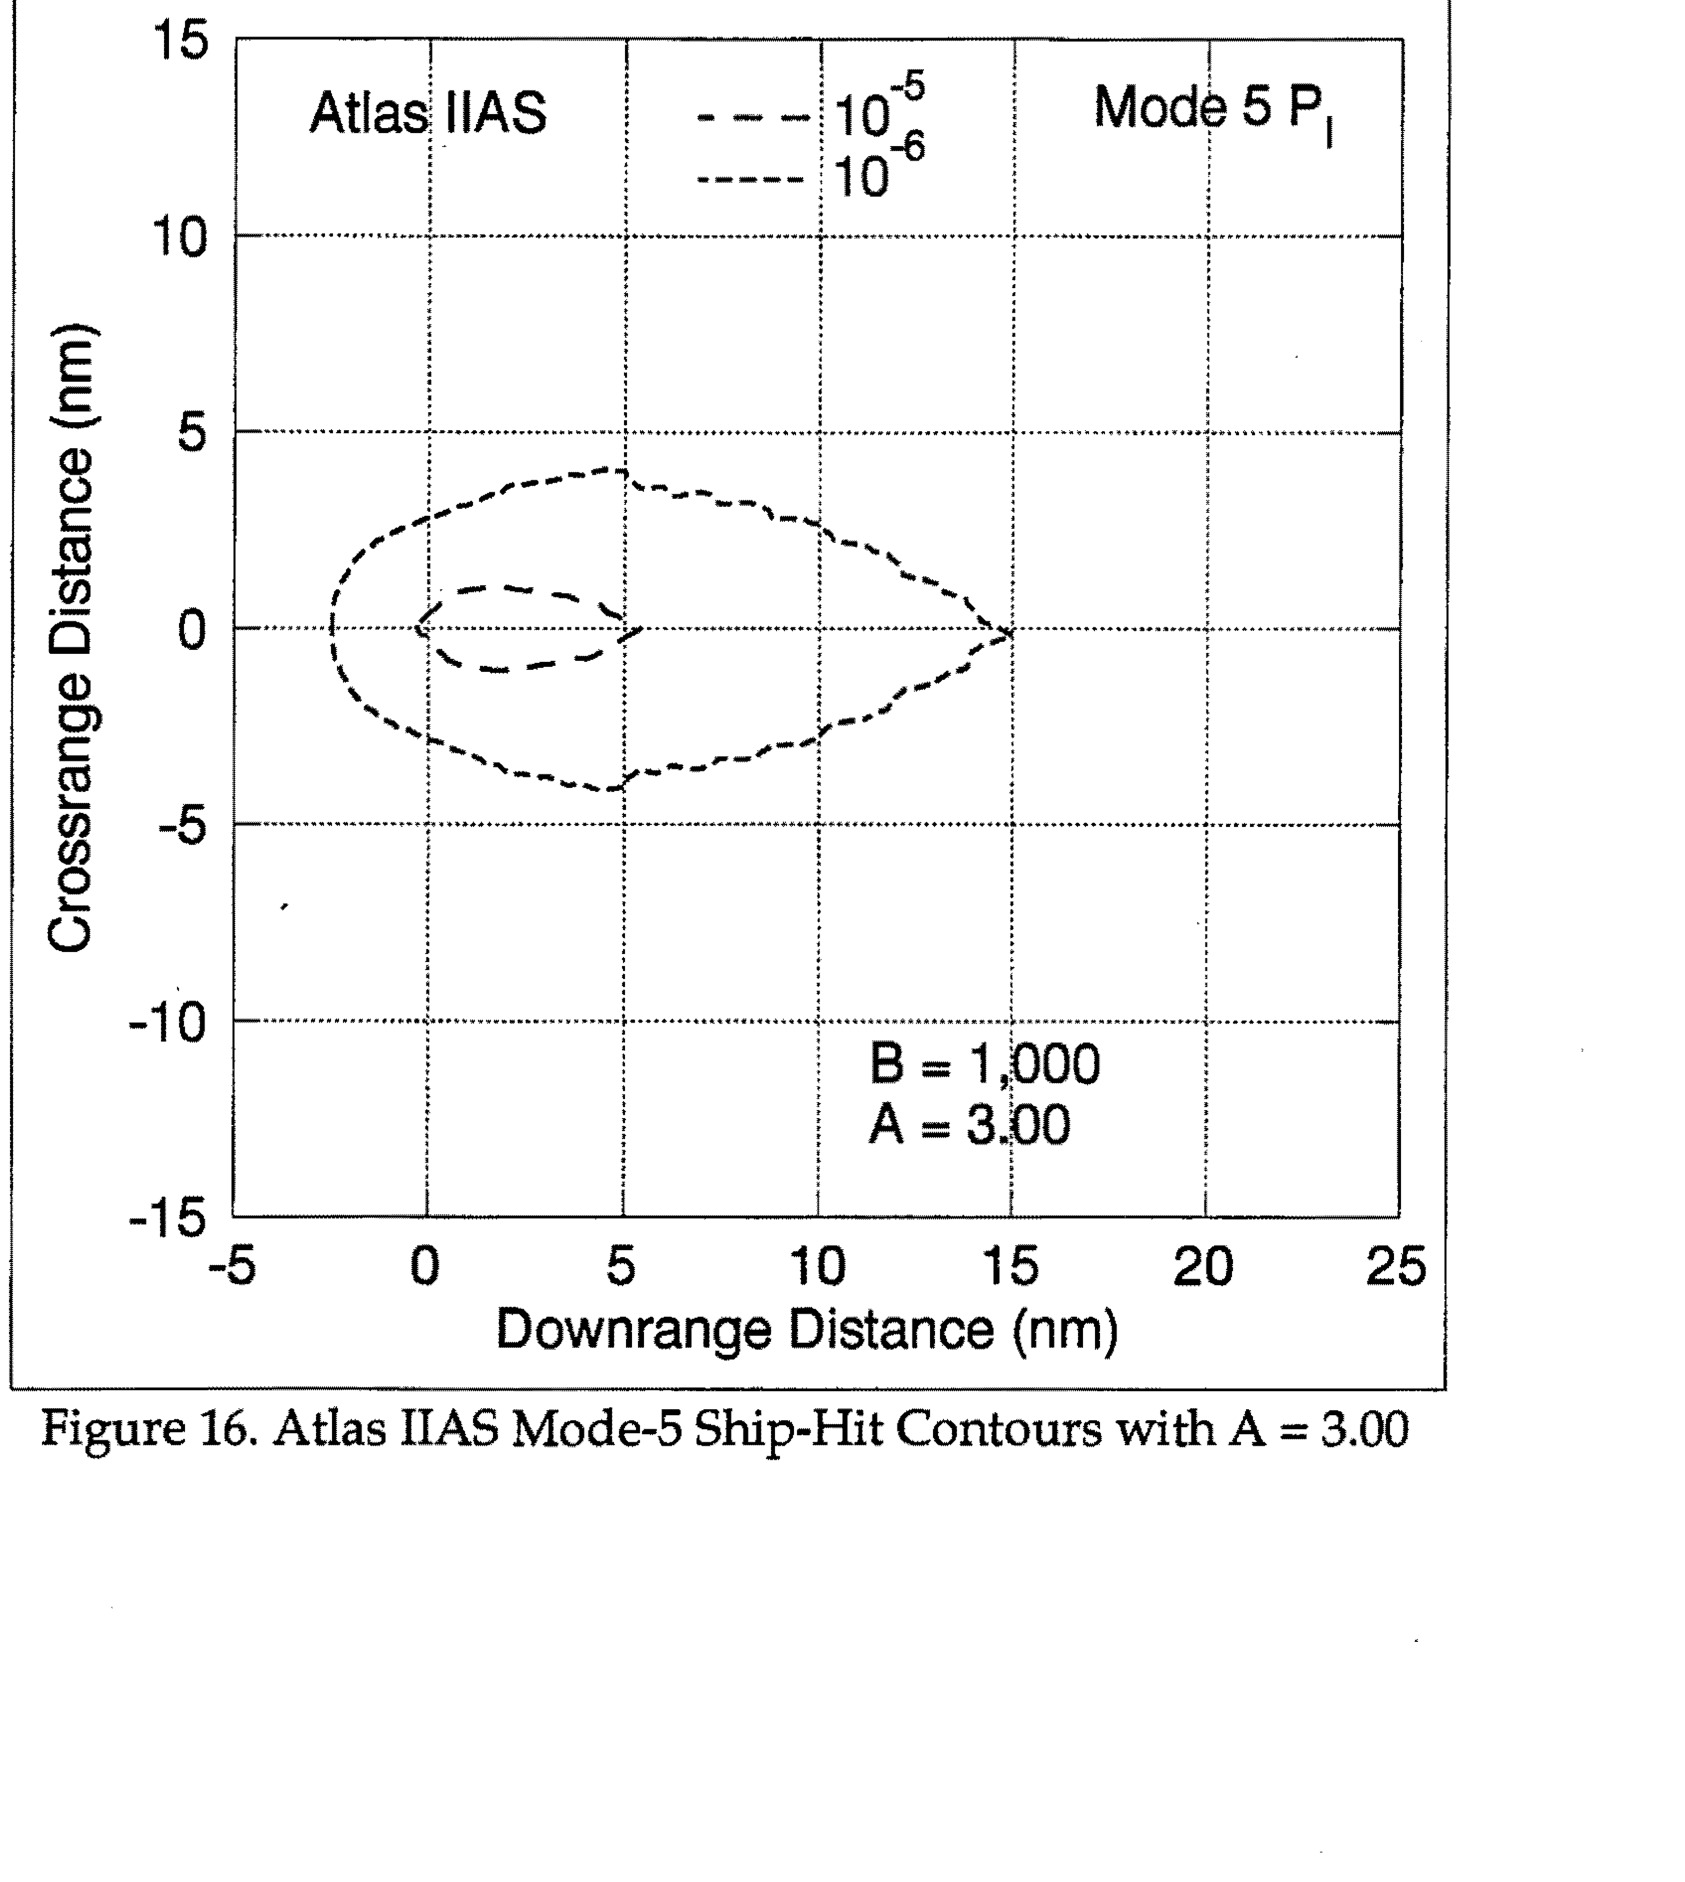
response 10.9* instead of 6.6 (0.033 ÷ 0.005 = 6.6) times as likely as a Mode-5 response, the differences in contours would be even less. Figure 16. Atlas IIAS Mode-5 Ship-Hit Contours with A = 3.00 * From Table 15, 86.2 ÷ 7.9 = 10.9. 9/10/96…
Figure 17. Atlas IIAS All-Mode Ship-Hit Contours with A = 3.00
Figure 18. Atlas IIAS Mode-5 Ship-Hit Contours with A = 3.45
Figure 19. Atlas IIAS All-Mode Ship-Hit Contours with A = 3.45
Figure 20. Atlas IIAS Mode-5 Ship-Hit Contours with A = 6.30
Figure 21. Atlas IIAS All-Mode Ship-Hit Contours with A = 6.30 6.2.4 Range Distributions of Theoretical and Simulated Impacts Earlier discussions had to do with how well the angular part of the Mode-5 impact density function could be made to agree with angular data derived from…
Figure 22. Impact-Range Distributions Theoretical impact percentages for the same 10-mile range intervals were obtained by integrating the Mode-5 impact-density function [Eq. (3)] between the angle limits of zero and π, and between the range limits of R₁ and R₂, and doubling the…
6.3 Shaping Constants for Delta-GEM Although less extensive, the computations made and graphs plotted to establish Mode-5 shaping constants for Delta parallel those described in Section 6.2 for Atlas IIAS. The approach may be summarized as follows: (1) Calculate impact points f…
6.3.1 Optimum Mode-5 Shaping Constants The percentage of Delta vehicles that break up during simulated random-attitude turns are plotted against failure time in Figure 23. The same breakup qq's used in the Atlas IIAS calculations were used here. It can be seen from the figure th…
Figure 24 shows the percentages of malfunction-turn impacts in 5° sectors for no breakup and for breakup qα's of 20,000, 10,000, and 5,000 deg-lb/ft². For B = 1,000, theoretical Mode-5 impacts are also plotted using best-fit values of A. This value of B was chosen since it is cur…
The simulated impact percentages plotted in Figure 25 are identical with those shown in Figure 24. The theoretical percentages in Figure 25 were obtained by trying various combinations of B and A until the best possible fit was obtained in the sectors from ±60° to ±180°. From the…
6.3.2 Launch-Area Mode-5 Risks Using values of A and B from Figure 24 and Figure 25, program DAMP was run to compute Mode-5 launch-area risks for population centers inside the impact limit lines for a Delta-GEM/GPS-10 daytime launch from Pad 17A. Results from these and two other…
for example, the risks are over 20 times as great if the vehicle's breakup qα is 20,000 rather than 5,000 deg-lb/ft². 6.4 Shaping Constants for Titan IV Mode-5 shaping constants for Titan IV were developed as described in Section 6.3 for Delta, except that a total of 290,000 si…
Figure 27 shows the percentages of malfunction-turn impacts in 5° sectors for no breakup and for breakup qα's of 20,000, 10,000, and 5,000 deg-lb/ft². For B = 1,000, theoretical Mode-5 impact distributions are also plotted in the figure using best-fit values of A. This value of B…
The simulated impact distributions plotted in Figure 28 are identical to those shown in Figure 27. The theoretical Mode-5 percentages were obtained by testing various combinations of B and A until a good fit between the simulated malfunction-turn results and theoretical impact-di…
The best-fit values of B and A shown in Figure 27 and Figure 28 are tabulated for convenient reference in Table 24. For breakup qα's of 10,000 and 5,000 deg-lb/ft², the currently-used value of B = 1,000 provided a better data fit than other values of B that were investigated. Ta…
6.5 Shaping Constants for LLV1 Shaping constants for LLV1 were developed as described in Section 6.3 for Delta, except that a total of 290,000 simulations were made between the programming time of 1 second and staging at 290 seconds. The percentages of vehicles that break up dur…
Figure 30 shows the percentage of malfunction-turn impacts in 5° sectors for no breakup, and for breakup qα's of 20,000, 10,000, and 5,000 deg-lb/ft². The three breakup qα's produced impact distributions that were surprisingly similar, possibly due to the vehicle's higher acceler…
Figure 31 shows that a good fit for the no-breakup case is possible if higher values of B and A are used. The simulated malfunction-turn impact distributions for the breakup cases plotted in this figure are identical with those in Figure 30. Since the theoretical percentages for…
The best-fit values of B and A from Figure 30 and Figure 31 have been listed for convenient reference in Table 25. It is interesting to note that, for all breakup conditions, the currently-used value of B = 1,000 provided a better data fit than any other B that was investigated.…
7. Potential Future Investigations
7. Potential Future Investigations Because of contract limitations on funds and the deadline for publishing the report, certain interesting facets of the Mode-5 modeling process could not be fully investigated. Several such issues are listed below in considered order of importan…
8. Summary In RTI's risk-computation program DAMP, vehicle failures per se are not considered. Instead each catastrophic failure is assumed to produce one of five failure responses, and it is these response modes that are modeled in DAMP. Although most catastrophic failures resu…
configurations (see Section D.1.4). The results, summarized previously in Table 6 of Section 5.1, are repeated here in Table 27. Flight phases 0 - 1 go from liftoff through first-stage or booster cutoff, while flight phase 2 extends through second-stage or sustainer cutoff. Altho…
these results, the relative probabilities used were more precise than those given in Table 28 and Table 29. No pretense is made that all figures in Table 30 are actually significant. Table 30. Absolute Failure Probabilities for Response Modes 1 - 5 Vehicle: | Atlas | | Delta |…
Traditionally, a value of B = 1,000 has been used by the 45 SW/SE in ship-hit calculations, and by RTI in performing launch-area risk analyses for the 45 SW/SE. Using this value of B, for each vehicle values of A were found that produced a good match between simulated and theoret…
important in the launch-area risk calculations provided an appropriate value of A is selected. Since a good data match within ±40° of the flight line was not found, the effect of this on ship-hit calculations was investigated. It was discovered that the values chosen for A and B…
Appendix A. Failure Response Modes in Program DAMP In program DAMP, no attempt is made to model vehicle behavior for failure of specific systems and components. A list of such failures and possible behaviors for any vehicle would be extensive, and variations from vehicle to vehi…
responses begin at vehicle pitch-over or programming for vertically-launched missiles, and at liftoff for those not launched vertically. Mode 6: Unlike impacts from response Modes 1 through 5, Mode-6 impacts result from normal flights and normal impacts of separated stages and c…
Appendix B. Shaping-Constant Effects on Mode-5 Impact Distributions
Appendix B. Shaping-Constant Effects on Mode-5 Impact Distributions The values chosen for shaping constants A and B that appear in the Mode-5 impact-density function [Eq. (3)] have a significant effect on the angular distribution of impacts about the launch point. This Appendix…
Table 33. Effect on f-Ratio of Varying Mode-5 Constant A (B = 1000) - Part 1
Table 33. Effect on f-Ratio of Varying Mode-5 Constant A (B = 1000) - Part 1 R = 1 nm R = 5 nm 180 - φ A = 2.5 A = 3.0 A = 3.5 A = 4.0 A = 2.5 A = 3.0 A = 3.5 A = 4.0 0 1.0 1.0 1.0 1.0…
Table 34. Effect on f-Ratio of Varying Mode-5 Constant A (B = 1000) - Part 2
Table 34. Effect on f-Ratio of Varying Mode-5 Constant A (B = 1000) - Part 2 R = 10 nm R = 25 nm 180-φ A=2.5 A=3.0 A=3.5 A=4.0 A=2.5 A=3.0 A=3.5 A=4.0 0 1.0 1.0 1.0 1.0 1.0 1.0 1.0 1.0 5…
Table 35. Effect on t-Ratio of Varying Mode-5 Constant B (A = 3) - Part 1 R = 1 nm R = 5 nm 180 - φ B = 500 B = 1000 B = 2000 B = 500 B = 1000 B = 2000 0 1.0 1.0 1.0 1.0 1…
Table 36. Effect on t-Ratio of Varying Mode-5 Constant B (A = 3) - Part 2
Table 36. Effect on t-Ratio of Varying Mode-5 Constant B (A = 3) - Part 2 R = 10 nm R = 25 nm 180 - φ B = 500 B = 1000 B = 2000 B = 500 B = 1000 B = 2000 0 1.0 1.0 1.0 1.0 1.0 1.0…
The f-ratios in Table 33 and Table 34 (also in Table 35 and Table 36) have been plotted in Figure 32 for A = 3.0 and B = 1000. Reading from the 10-mile plot for θ = 90°, it can be seen that a vehicle experiencing a Mode-5 response is about 60 times more likely to impact along the…
There are other ways to show how the value chosen for A affects the Mode-5 impact density function. For five values of A, the plots in Figure 33 show the percentages* of Atlas IIAS impacts that lie between the flight line and any radial line through the launch point that makes an…
Another way to show how the value of A affects Mode-5 impacts is illustrated in Figure 34. For the same values of A used previously in Figure 33, the graphs in Figure 34 show the percentages of impacts in any 5° sector between radials that make angles of θ° and (θ + 5)° with resp…
where p is the probability of occurrence of the GFDF mode, Tₛ is the stage burn time, and Ṙ is the rate of change of the impact range. The function cannot be applied early in flight before programming when Ṙ is essentially zero. The range portion of the Mode-5 impact-density func…
Appendix C. Filter Characteristics Estimating launch-vehicle failure probabilities using empirical launch data is an uncertain process when the sample size is small and the data are obtained from an evolving system. One approach that may be used to estimate failure probabilities…
X̄ₙ = X̄ₙ₋₁(1-aₙ)+xₙ(aₙ) X̄ₙ = X̄ₙ₋₁+aₙ(xₙ - X̄ₙ₋₁) (12) For the equally-weighted case, the recursive filter factor aₙ = 1/n. Using the same example, with X̄ₒ = 0, X̄₁ = x₁ = 6 X̄₂ = X̄₁+1/2(x₂-X̄₁) = 6+1/2(5-6) = 5.5 (13) X̄₃ = X̄₂+1/3(x₃-X̄₂) = 5.5+1/3(7-5.5) = 6.0 In…
For the recursive form of this filter, where each datum is weighted by its position in the chronological sequence, the recursive filter factor for the nth point is given by an = n/∑i=1n i = 2n/n(n+1) = 2/n+1 (16) Using Eq. (12), n=1 | a1=1 | X̄1=x1=6 n=2 | a2=2/3 | X̄2=6+2…
F = 0.8, only the most recent 25 or so data points contribute to the final result, since all older data points are essentially weighted out of the solution. Figure 35. Exponential Weights for Fading-Memory Filters For the exponentially-weighted fading-memory filter, it can be s…
show that an approaches 1/n, the filter-factor value for the equally-weighted case, and the filter memory no longer fades. For values of F between zero and one, the rate at which the filter memory fades decreases as F increases. The analyst can control the rate at which the filte…
The fading-memory recursive filter, defined by Eqs. (12) and (20), can be applied to launch test results to estimate failure probability. For this application the values to be filtered are the test outcomes, with 0 representing a successful launch, and 1 representing a failure or…
Appendix D. Launch and Performance Histories D.1 Basic Data In support of the empirical approach to use post-test results to estimate future vehicle failure rates, the performance histories for Atlas, Delta, Titan, and Thor missiles/vehicles were studied. Results are summarized…
(4) "Spacelift Effective Capacity: Part 1 - Launch Vehicle Projected Success Rate Analysis", Draft prepared by Booz•Allen & Hamilton, Inc. 19 February 1992, prepared for Air Force Space Command Launch Services Office.[4] (5) Isakowitz, Steven J., (updated by Jeff Samella), Inter…
used to order the vehicle tests for filtering, whether the dates are inconsistently in local or Greenwich times is inconsequential. In most cases, the ordering is not affected by a one-day change in launch date. In rare cases where the order of two launches might be inadvertently…
Table 38. Flight-Phase Definitions Flight Phase | Description 0 | SRM auxiliary thrust phase 1 | First-stage thrust phase if no auxiliary SRM's carried, or First-stage thrust phase after SRM separation 1.5 | Attitude-control phase after first-stage thrust phase or between…
D.1.4 Representative Configurations The last column in the tables in Appendix D indicates whether the vehicle configuration is considered sufficiently similar to current and future vehicles for the test result to be included in the representative data sample used to predict abso…
D.2 Atlas Launch and Performance History Atlas space-launch vehicles, originally manufactured by General Dynamics and currently by Lockheed Martin, derived from the Atlas ICBM series developed in the 1950s. The primary one-and-one-half-stage vehicle played a major role in early…
Atlas vehicles are fueled by a mixture of liquid oxygen and kerosene (RP-1). The latest IIAS configuration also incorporates Castor IVA solid-rocket motors. The early Atlas core vehicle included a sustainer, verniers, and two booster engines, all ignited prior to liftoff. In the…
D.2.1 Atlas Launch History
D.2.1 Atlas Launch History The data in Table 41 summarize the flight performance of all Atlas and Atlas-boosted space-vehicle launches since the program began in June 1957. A launch sequence number is provided in the first column, a mission ID and launch date in columns 2 and 3.…
No. | Mission/ID | Launch Date | Vehicle Configuration | Test Range | Response Mode | Flight Phase | Rep. Cnf. 32 | WS | 09/16/59 | 17D | ER | 4 | 2.5 | 0 33 | WS | 10/06/59 | 18D | ER | | | 0 34 | WS | 10/09/59 | 22D | ER | | | 0 35 | WS | 10/29/59 | 26D | ER | 4 | 2.5 | 0 36 |…
No. | Mission/ID | Launch Date | Vehicle Configuration | Test Range | Response Mode | Flight Phase | Rep. Conf. 78 | MERCURY 2 | 02/21/61 | 67D LV-3B | ER | | | 0 79 | WS | 02/24/61 | 9E | ER | | | 0 80 | WS | 03/13/61 | 13E | ER | 4 | 2 | 0 81 | WS | 03/24/61 | 16E | ER | 4 | 1,…
No. | Mission/ID | Launch Date | Vehicle Configuration | Test Range | Response Mode | Flight Phase | Rep. Conf. 124 | CURRY COMB II | 04/11/82 | 129D | WR | | | 0 125 | RANGER 4 | 04/23/82 | 133D, LV-3A/AGENA B | ER | | | 0 126 | Dainty Doll | 04/26/82 | 118D, LV-3A/AGENA B | WR…
No. | Mission/ID | Launch Date | Vehicle Configuration | Test Range | Response Mode | Flight Phase | Rep. Conf. 170 | TALL TREE 4 | 03/23/63 | 52F | WR | 4 | 1 | 0 171 | BLACK BUCK | 04/24/63 | 65E | WR | NA | 2.5 | 0 172 | ABRES-2 | 04/26/63 | 135F | ER | | | 0 173 | Damp Clay |…
No. | Mission/ID | Launch Date | Vehicle Configuration | Test Range | Response Mode | Flight Phase | Rep. Cont. 216 | KNOCK WOOD | 07/29/64 | 248D | WR | | | 0 217 | LARGE CHARGE | 08/07/64 | 110F | WR | | | 0 218 | Big Sickle | 08/14/64 | 7101, SLV-3A/AGENA D | WR | | | 1 219 |…
No. | Mission/ID | Launch Date | Vehicle Configuration | Test Range | Response Mode | Flight Phase | Rep. Conf. 262 | AC-6 | 08/11/65 | 151D, LV-3C/CENTAUR D | ER | | | 0 263 | TONTO RIM | 08/26/65 | 61D | WR | | | 0 264 | WATER SNAKE | 09/29/65 | 125D | WR | | | 0 265 | Log Fog…
No. | Mission/ID | Launch Date | Vehicle Configuration | Test Range | Response Mode | Flight Phase | Rep. Cont. 308 | LOW HILL | 10/11/66 | 115F | WR | 4 | 1 | 0 309 | Gleaming Star | 10/12/66 | 7122, SLV-3/AGENA D | WR | | | 1 310 | AC-9 | 10/26/66 | 174D, LV-3C/CENT. D | ER | N…
No. | Mission/ID | Launch Date | Vehicle Configuration | Test Range | Response Mode | Flight Phase | Rep. Conf. 354 | ABRES (AFSC) | 03/06/68 | 74E | WR | | | 0 355 | AFSC | 04/06/68 | 107F/ABRES | WR | | | 0 356 | ABRES (AFSC) | 04/18/68 | 77E | WR | | | 0 357 | ABRES (AFSC) | 0…
No. | Mission/ID | Launch Date | Vehicle Configuration | Test Range | Response Mode | Flight Phase | Rep. Conf. 400 | PIONEER 10 (AC-27) | 03/02/72 | 5007C, SLV-3C/CENTAUR D | ER | | | 1 401 | INTELSAT IV F-5 (AC-29) | 06/13/72 | 5009C, SLV-3C/CENTAUR D | ER | | | 1 402 | OAO-C (…
No. | Mission/ID | Launch Date | Vehicle Configuration | Test Range | Response Mode | Flight Phase | Rep. Conf. 446 | TIROS N | 10/13/78 | 29F | WR | | | 0 447 | HEAO-B (AC-52) | 11/13/78 | 5032D, SLV-3D/CENT D-1A | ER | | | 1 448 | NAVSTAR IV | 12/10/78 | 39F | WR | | | 0 449 |…
No. | Mission/ID | Launch Date | Vehicle Configuration | Test Range | Response Mode | Flight Phase | Rep. Conf. 492 | DMSP F-9 | 02/02/88 | 54E | WR | | | 0 493 | NOAA-H | 09/24/88 | 63E | WR | | | 1 494 | FLTSATCOM F-8 (AC-68) | 09/25/89 | 5047G/CENT D-1A | WR | | | 0 495 | P87-…
D.2.2 Atlas Failure Narratives The following narratives provide the available details about each Atlas failure since the beginning of the Atlas program. The narratives are numbered to match the flight-sequence numbers in Section D.2.1. 1. 4A, 11 June 57, Response Mode 4T, Fligh…
9. 3B, 19 July 58, Response Mode 4T, Flight Phase 1: Random failure of yaw rate gyro caused violent maneuvers resulting in rupture of LO₂ tank, engine shutdown, and a fire near the lube oil drain. Missile broke up about 42 seconds with impact about 2 miles downrange and 0.4 miles…
22. 7C, 18 Mar 59, Response Mode 4, Flight Phase 1: Booster engines shut down prematurely at 129.4 seconds, but booster section was not jettisoned until the near-normal time of 153 seconds. Guidance was inoperative. Since the sustainer engine could not gimbal before booster separ…
38. 20D (Able IV), 26 Nov 59, Response Mode 4, Flight Phase 1: Third and fourth stages and payload broke off about 47 seconds. Atlas flight was normal and second stage ignited properly after Atlas SECO. 43. 6D (Dual Exhaust), 26 Jan 60, Response Mode 4, Flight Phase 2 and 2.5: A…
58. 50D (Mercury), 29 July 60, Response Mode 4, Flight Phase 1: Flight appeared normal till 57.6 seconds when missile broke up apparently due to a rupture of the forward section of the LO₂ tank. 61. 47D (Golden Journey), 12 Sep 60, Response Mode 4, Flight Phase 2: Flight was app…
72 and 73 seconds, and a final explosion occurred at 74 seconds. Impact was about 8 miles downrange and one mile crossrange. 76. 8E, 24 Jan 61, Response Mode 5, Flight Phase 2: Missile stability was lost at about 161 seconds, some 30 seconds after BECO, probably due to failure o…
94. 26E, 8 Sep 61, Response Mode 4, Flight Phase 2: Sustainer engine shut down prematurely during the booster jettison sequence. Most probable cause was drop in fuel flow to the gas generator. The vernier engines continued to burn for about 28 seconds after the sustainer shut dow…
Sustainer engine shut down at 282 seconds. Missile impacted 1300 miles downrange and 18 miles crossrange. 111. 114D (LV-3A)/Agena B (Ocean Way), 22 Dec 61, Response Mode NA, Flight Phase 2: Flight was considered successful although a failure in the flight programmer prevented th…
131. LV-3A/Agena B (Rubber Gun), 17 June 62, Response Mode 4, Flight Phase 3: Although Atlas performance was satisfactory, the mission was apparently a failure. No other data available. 134. 67E (Extra Bonus), 13 July 62, Response Mode 4, Flight Phase 2 and 2.5: A LOX leak in th…
94.3 seconds. A thrust-section fire before 20 seconds apparently failed the lube oil system, which led to cessation of propellant flow. 156. 131D LV-3A/Agena B (Bargain Counter), 17 Dec 62, Response Mode 4T, Flight Phase 1: Mission failed because of an Atlas hydraulic failure. M…
the x and z velocity channels. As a result, the missile impacted about 12 miles short and 0.2 miles right of target. 170. 52F (Tall Tree 4), 23 Mar 63, Response Mode 4, Flight Phase 1: Missile self-destructed at about 91 seconds for unknown reasons. Impact was near the flight li…
191. 163D (Cool Water V), 7 Oct 63, Response Mode 4, Flight Phase 1: Flight was normal up to about 73 seconds when the missile exploded. Suspected cause was intermediate bulkhead reversal/rupture due to insufficient helium pressure. 194. 136F (ABRES), 28 Oct 63, Response Mode 4T…
240. 156D, 2 Mar 65, Response Mode 1 Flight Phase 1: At 0.36 seconds booster fuel-pump pressure dropped due to a fuel prevalue failure, booster lost thrust, fell back on launch pad, and was destroyed at 3.26 seconds. 251. 68D/ABRES (Tennis Match), 27 May 65: Response Mode 4, Fli…
maintain thrust. Thrust imbalance resulted in tumbling, followed by fuel starvation, and early thrust termination. 284. 208D (Crab Claw), 3 May 66, Response Mode 4T, Flight Phase 1: High engine-compartment temperatures were first noted at 41 seconds. The sustainer pitch-actuator…
318. 148F (Busy Stepson), 17 Jan 67, Response Mode NA, Flight Phase 2.5: Flight was normal except that reentry vehicle failed to separate. 344. 81F (ABRES/AFSC), 27 Oct 67, Response Mode 4T, Flight Phase 1: Although various anomalous events occurred early in flight, the missile…
388. 5003C AC-21 (OAO-B), 30 Nov 70, Response Mode 4, Flight Phase 2: Since the nose fairing failed to separate, Centaur did not have enough energy to make orbit. Payload impacted in Africa. 392. 5405C AC-24 (Mariner 8 Mars), 8 May 71, Response Mode 4T, Flight Phase 3: Mission r…
caused yaw and roll rates that the flight control system could not correct. As a result, attitude control was lost and the thrusting sustainer pivoted the missile to a retrofire attitude before the vehicle could be stabilized. After the booster package was jettisoned, the missile…
engine, thus preventing the engine from achieving full thrust. Due to the resulting thrust imbalance, the vehicle tumbled out of control. Destruct was sent some 80 seconds after Centaur ignition. 506. 5051 AC-71 (Galaxy 1R), 22 Aug 92, Response Mode 4T, Flight Phase 3: A Centaur…
D.3 Delta Launch and Performance History
D.3 Delta Launch and Performance History The Delta launch-vehicle family originated in 1959 with a NASA contract to Douglas Aircraft Company, now McDonnell Douglas Corporation. The Delta, using components form USAF's Thor IRBM program and USN's Vanguard launch-vehicle program, w…
Configuration | Description 1910, 1913, 1914 | Stg. 0: Nine Castor IIs employed Stg. 3: Varied: none (1910), TE-364-3 (1913), TE-364-4 (1914) PLF: 96-inch diameter replaced 65-inch 2310, 2313, 2314 | Stg. 0: Three Castor IIs employed Stg. 1: RS-27 replaced MB-3 Stg. 2: TR-201 eng…
The entire Delta history through 1995 is depicted rather compactly in bar-graph form in Figure 38. The solid-block portion of each bar indicates the number of launches during the calendar year for which vehicle performance was entirely normal, in so far as could be determined. Th…
D.3.1 Delta Launch History
D.3.1 Delta Launch History The data in Table 43 summarizes all Delta and Delta-boosted space-vehicle launches since the program began. A launch sequence number is provided in the first column. A launch ID and date are provided in columns 2 and 3. The fourth column indicates the…
No. | Mission/ID | Launch Date | Vehicle Configuration | Test Range | Response Mode | Flight Phase | Rep. Conf. 31 | IMP-C | 05/29/65 | DSV-3C | ER | | | 0 32 | TIROS OT-1 | 07/01/65 | DSV-3C | ER | | | 0 33 | OSO-C | 08/25/65 | DSV-3C | ER | 4 | 2,5 | 0 34 | GEOS A | 11/06/65 |…
No. | Mission/ID | Launch Date | Vehicle Configuration | Test Range | Response Mode | Flight Phase | Rep. Conf. 77 | NATO-A | 03/20/70 | DSV-3L | ER | | | 0 78 | INTELSAT III-G | 04/22/70 | DSV-3L | ER | NA | 1 & 5 | 0 79 | INTELSAT III-H | 07/23/70 | DSV-3L | ER | | | 0 80 | IDC…
No. | Mission/ID | Launch Date | Vehicle Configuration | Test Range | Response Mode | Flight Phase | Rep. Conf. 123 | LAGEOS | 05/04/76 | 2913 | WR | | | 1 124 | MARISAT-B | 06/10/76 | 2914 | ER | | | 1 125 | PALAPA-A | 07/08/76 | 2914 | ER | | | 1 126 | ITOS-E2 | 07/29/76 | 2910…
No. | Mission/ID | Launch Date | Vehicle Configuration | Test Range | Response Mode | Flight Phase | Rep. Cnt. 169 | EXOSAT | 05/26/83 | 3914 | WR | | | 1 170 | GALAXY-A | 06/28/83 | 3920 PAM | ER | | | 1 171 | TELSTAR-3A | 07/28/83 | 3920 PAM | ER | | | 1 172 | RCA-G | 09/08/83…
No. | Mission/ID | Launch Date | Vehicle Configuration | Test Range | Response Mode | Flight Phase | Rep. Conf. 215 | COPERNIKUS | 10/12/92 | 7925 | ER | | | 1 216 | NAVSTAR II-16 | 11/22/92 | 7925 | ER | | | 1 217 | NAVSTAR II-17 | 12/18/92 | 7925 | ER | | | 1 218 | NAVSTAR II-1…
D.3.2 Delta Failure Narratives
D.3.2 Delta Failure Narratives The following narratives provide available details about each Delta failure since the beginning of the Delta program. The narratives are numbered to match the flight-sequence numbers in Section D.3.1. 1. Echo I, 13 May 60, Response Mode 4, Flight…
spacecraft into a lunar orbit. Possible cause was malfunction of the coast-control system after third-stage spinup and separation. 59. Intelsat III A, 18 Sep 68, Response Mode 5, Flight Phase 1: Due to loss of rate gyro, undamped pitch oscillations began at 20 seconds. Vehicle b…
96. ITOS-E (WTR), 16 July 73, Response Mode 4T, Flight Phase 2: Pump-motor failure during second-stage burn at 490 seconds resulted in loss of hydraulic pressure, loss of attitude control, and vehicle tumbling. 100. Skynet IIA, 19 Jan 74, Response Mode NA, Flight Phase 4 and 5:…
228. Koreasat, 5 Aug 95, Response Mode NA, Flight Phase 1 and 5: One of three air-ignited strap-on GEMs did not separate because of a malfunction in the separation explosive transfer system. Failure to drop a GEM motor resulted in depletion of second-stage propellants. Although p…
D.4 Titan Launch and Performance History
D.4 Titan Launch and Performance History The Titan family of launch vehicles was established in 1955, when the Air Force awarded the Martin Company a contract to build a heavy-duty space system. Titan I was the nation's first two-stage ICBM and the first to be silo-based. It pro…
Shortly after the Challenger accident in 1986, when the US government decided to offload commercial payloads from the Space Shuttle, Martin Marietta announced plans to develop a Titan III commercial launch vehicle with its own funds. The commercial Titan III is derived from the T…
The entire Titan history through 1995 is depicted rather compactly in bar-graph form in Figure 39. The solid-block portion of each bar indicates the number of launches during the calendar year for which vehicle performance was entirely normal, in so far as could be determined. Th…
D.4.1 Titan Launch History The data in Table 45 summarizes all Titan and Titan-boosted space-vehicle launches since the program began. A launch sequence number is provided in the first column. A launch ID and date are provided in columns 2 and 3. The fourth column indicates the…
No. | Mission/ID | Launch Date | Vehicle Configuration | Test Range | Response Mode | Flight Phase | Rep. Conf. 31 | WS | 02/20/61 | I (J-13) | ER | | | 0 32 | WS | 03/03/61 | I (J-12) | ER | 4 | 2 | 0 33 | WS | 03/28/61 | I (J-14) | ER | | | 0 34 | WS | 03/31/61 | I (J-15) | ER…
No. | Mission/ID | Launch Date | Vehicle Configuration | Test Range | Response Mode | Flight Phase | Rep. Conf. 77 | WS | 05/09/63 | II (N-14) | ER | 4 | 2 | 0 78 | FLYING FROG | 05/13/63 | II (N-19) | WR | | | 0 79 | WS | 05/24/63 | II (N-17) | ER | | | 0 80 | WS | 05/29/63 | II…
No. | Mission/ID | Launch Date | Vehicle Configuration | Test Range | Response Mode | Flight Phase | Rep. Cont. 123 | LONG BALL | 07/21/65 | II (B-62) | WR | | | 0 124 | MAGIC LAMP | 08/16/65 | II (B-6) | WR | | | 0 125 | SV: GEMINI GT-5 | 08/21/65 | II (G-5) | ER | | | 0 126 | N…
No. | Mission/ID | Launch Date | Vehicle Configuration | Test Range | Response Mode | Flight Phase | Rep. Conf. 169 | AFSC | 12/05/67 | IIIB/AGENA D (23B) | WR | | | 1 170 | AFSC | 01/18/68 | IIIB/AGENA D (23B) | WR | | | 1 171 | GLORY TRIP 4T | 02/28/68 | II (B-88) | WR | | | 0…
No. | Mission/ID | Launch Date | Vehicle Configuration | Test Range | Response Mode | Flight Phase | Rep. Conf. 215 | AFSC | 05/20/72 | IIIB/AGENA D (24B-4) | WR | | | 1 216 | M2-10 | 05/24/72 | II (B-46) | WR | | | 0 217 | AFSC | 07/07/72 | IIID (23D-5) | WR | | | 1 218 | AFSC |…
No. | Mission/ID | Launch Date | Vehicle Configuration | Test Range | Response Mode | Flight Phase | Rep. Conf. 261 | AFSC | 09/15/76 | IIIB/AGENA D (24B-17) | WR | NA | 2 | 1 262 | AFSC | 12/19/76 | IIID (23D-15) | WR | | | 1 263 | SV-DSP | 02/06/77 | IIIC-23/Trans. | ER | | | 1…
No | Mission/ID | Launch Date | Vehicle Configuration | Test Range | Response Mode | Flight Phase | Rep. Conf. 307 | AFSC | 04/18/86 | 34D-9 | WR | 4 | 0 | 1 308 | AFSC | 02/11/87 | IIIB/AGENA D (34B-11) | WR | | | 1 309 | AFSC | 10/26/87 | 34D-15 | WR | | | 1 310 | SV-DOD | 11/2…
D.4.2 Titan Failure Narratives
D.4.2 Titan Failure Narratives The following narratives provide available details about each Titan failure since the beginning of the Titan I program in 1959. The narratives are numbered to match the flight-sequence numbers in Section D.4.1. 7. B-5, 14 Aug 59, Response Mode 1,…
28. J-9, 20 Dec 60, Response Mode 4, Flight Phase 2: No Stage-II ignition due to failure of gas generator to start. 29. J-10, 20 Jan 61, Response Mode 4, Flight Phase 2: No Stage-II operation due to erroneous signal that appeared at umbilical disconnect. Impact some 420 miles do…
50% reduction of sustainer thrust for remainder of Stage II operation. Impact was 2888 miles short of target. 63. I (Yellow Jacket), 5 Dec 62, Response Mode 4T, Flight Phase 2: Missile was command destructed at 250 seconds. No other data available. 64. N-11, 6 Dec 62, Response…
81. Titan II (Thread Needle), 20 June 63, Response Mode 5, Flight Phase 2: Flight appeared normal until BECO at about 146 seconds. The staging event seemed abnormally long, due to low second-stage thrust that remained considerably below normal thereafter because of reduced oxidiz…
127. Titan II (Bold Guy), 21 Sep 65, Response Mode 4, Flight Phase 2: After a normal first-stage flight, the second stage was shut down immediately after start by an erroneous guidance command. 128. IIIC (65-212), 15 Oct 65, Response Mode NA, Flight Phase 4 and 5: Normal mission…
200. IIIC-19, 6 Nov 70, Vehicle 19, Response Mode NA, Flight Phase 3.5 and 5: All booster systems performed essentially as planned. Transtage experienced a guidance anomaly during coast prior to second burn resulting in an improper orbit. 212. IIIB/Agena D (AFSC), 16 Feb 72, Res…
S/A-1 shut down at 213 sec due to failure of its turbopump assembly. The vehicle continued flight till 221 seconds when erratic attitude rates were noted. At 229 seconds, the impact point stopped. At 257 seconds, the pressure dropped to zero in the stage-1 thrust-chamber assembly…
D.5 Thor Launch and Performance History (Not Including Delta) The entire Thor history is depicted rather compactly in bar-graph form in Figure 40. The solid-black portion of each bar indicates the number of launches during the calendar year for which vehicle performance was enti…
Mode column. The seventh column indicates the operational flight phase during which the failure occurred. The last column indicates whether the vehicle configuration is representative of those being launched today. Table 46. Thor Launch History No. | Mission/ID | Launch Date |…
No. | Mission/ID | Launch Date | Vehicle Configuration | Test Range | Response Mode | Flight Phase | Rep. Conf. 42 | WS | 06/11/59 | ABLE II (137) | ER | | | 0 43 | WS | 06/25/59 | 198 | ER | | | 0 44 | WS | 06/29/59 | 194 | ER | NA | 1.5 | 0 45 | WS | 07/21/59 | 203 | ER | 3 | 1…
D.5.2 Thor and Thor-Boosted Failure Narratives The following narratives provide information about flight failure of Thor weapons system and Thor-boosted space vehicle launches beginning with the first Thor launch in January 1957. The narratives are numbered to match the flight-s…
vehicle was destroyed by the RSO at 152 seconds. Missile impacted about 60 miles downrange. 12. 120, 28 Feb 58, Response Mode 4, Flight Phase 1: Failure of fuel line caused premature main engine shutdown at 109.7 seconds. 13. 121, 19 Apr 58, Response Mode 1, Flight Phase 1: Fai…
depletion before to reaching cutoff conditions. Impact was 28 miles short of target. 28. 146, 16 Dec 58, Response Mode 4, Flight Phase 1: Although flight was considered a success, the main-engine fuel valve remained partially open for 14 seconds after MECO command was given. Thi…
67. 281 (Transit 2A), 22 June 60, Response Mode NA, Flight Phase 2 and 5: Although boost phase was normal, anomalous performance during second-stage burn produced an orbit with apogee of 570 miles and perigee of 341 miles instead of the planned 500-mile circular orbit. 68. 262 (…
References 1. Montgomery, R. M., and Ward, J. A., "Computations of Hit Probabilities From Launch-Vehicle Debris", RTI/4666/02F, September 19, 1990. 2. Eastern Test Range Directorate of Safety Post-Test Report, Test D1000, 18 June 1991. 3. Ward, James A., "Baseline Launch-Area…
15. "Titan IV, America's Silent Hero", published by Lockheed Martin in Florida Today, 13 Nov 95. 16. "Atlas Program Flight History" (through April 1965), General Dynamics Report EM-1860, 26 April 1965. 17. Fenske, C. W., "Atlas Flight Program Summary", Lockheed Martin, April 19…